Showing posts with label ACA marketplace. Show all posts

Wednesday, July 01, 2026

Fleshing out the ACA marketplace's alleged phantom enrollees, Part 2

Note: Free xpostfactoid subscription is available on Substack alone, though I will continue to cross-post on this site. If you're not subscribed, please visit xpostfactoid on Substack and sign up.

Your income next year may be $14,000? Can you earn a little more?


It’s time for Part 2 of our close look at Brian Blase’s claims in The Persistent Obamacare Enrollment Fraud and its top-line claim (heavily relied on by CMS) that in 2026, 6.2 million enrollments were “improper.” To reiterate a few big-picture points from Part 1:

1. Blase rhetorically conflates what he’s branded as “the great Obamacare fraud” with enrollments he deems “improper” — that is, enrollments that may show some evidence that the applicant’s estimate of next-year income has been optimized to maximize subsidies. That segue is parroted by CMS in last week’s ASPE brief:

Enrollment that is improper or fraudulent is enrollment by individuals misstating their income to gain access to free plans. Phantom enrollees are unknowingly enrolled in free plans by brokers or auto enrolled. By our estimate, improper, phantom and fraudulent enrollment peaked at 5.6 million people in 2025.

2. The allegations of outright fraud — “phantom” enrollees signed up by brokers, who have no knowledge of their enrollment or no intent to use it— are chiefly based on an analysis of CMS data on ‘enrollees without claims’ (EWOC). This analysis, which ignores the high incidence of short-term enrollment in HealthCare.gov states, driven by year-round enrollment and by the Medicaid unwinding of 2023-2024 — has been effectively rebutted by Matt Fiedler (1, 2) and others. While broker fraud may have given some boost to EWOC, true “phantom” enrollments are small percentage of the enrollments branded as “improper.” As last week’s ASPE brief notes, “In 2025, CMS canceled coverage for 250,000 people enrolled without consent and identified 200,000 unauthorized plan switches.”

Thursday, June 11, 2026

Fleshing out the ACA marketplace's alleged phantom enrollees

Note: Free xpostfactoid subscription is available on Substack alone, though I will continue to cross-post on this site. If you're not subscribed, please visit xpostfactoid on Substack and sign up.

If you stop paying for your ACA plan, do you exist?

Now cometh Brian Blase and his colleagues from the right-wing Paragon Health Institute with his third iteration of the so-called “Great Obamacare Enrollment Fraud” (rechristened “The Persistent Obamacare Fraud”) — this time claiming 6.2 million “improper” enrollments .

I wanted to get “fraud” and “improper enrollment” in one sentence, because Blase conceptually segues from outright fraud— people enrolled without their consent, or under false pretenses — to “improper” enrollment, which he defines as enrollments in which the applicant’s future-looking income estimate may have been optimized to her advantage — usually by a broker. The original report deemed all enrollments with allegedly massaged income “fraud.”

Paragon’s core claim, which has not changed substantially since the first iteration of this report in 2024, is that the number of enrollees who estimate 2026 income in the 100-150% FPL range — 10.7 million, or 46% of all enrollees — far exceeds the Census Bureau’s survey-based estimates of the eligible population with income in that range. It’s doubtless true that many enrollees optimize their income estimates, usually at a broker’s direction - -e.g., to get over the 100% FPL eligibility thresholds in the 10 states that have not expanded Medicaid (available to adults with income up to 138% FPL in expansion states), or to get below 150% FPL, the eligibility threshold for the highest level of Cost Sharing Reduction (CSR).

Wednesday, May 20, 2026

ACA marketplace enrollment erosion update

Note: Free xpostfactoid subscription is available on Substack alone, though I will continue to cross-post on this site. If you're not subscribed, please visit xpostfactoid on Substack and sign up.


Last week, Paige Cunningham at Notus reported* that effectuated ACA marketplace enrollment in April was down 21% from end-of-OEP plan selection totals in the 30 states using HealthCare.gov. For all states, April totals were 17% below end-of-OEP, as attrition was far lower in the 20 states that run their own marketplaces. * About half of the SBMs have somewhat mitigated the effect of the expiration of the enhanced subsidies that were funded only through 2025, offering either supplemental state subsidies, strict silver loading, or Basic Health Programs.

As Charles Gaba has highlighted, the end-of-OEP-to-April drop in 2026 was just about double the 2025 drop of 8.8%. Year-over-year, effectuated enrollment in April is down 13.5%, from 22.2 million in 2025 to 19.2 million this year.

One caveat about terminology that will be relevant going forward: Cunningham reports that 21% of end-of-OEP enrollees in the FFM were “dropped from coverage” after failing to pay their first premium. What she actually appears to have reported, though, is a net difference between total plan selections as of the end of OEP and effectuated enrollment in April. Every month, some people drop coverage and others newly obtain it via individually granted Special Enrollment Periods (SEPs), available after various types of life changes, such as losing employer-sponsored coverage. From February of 2022 to August of last year, SEPs were automatically granted to anyone who reported a qualifying income below 150% FPL. Trump’s CMS cut that automatic SEP off as of August 2025 (a change ratified in the Republican monster bill signed on July 4, 2025) - - and consequently, enrollment dropped from April to December last year for the first time since 2020. (In 2021, a pandemic-induced emergency SEP effectively kept enrollment open to all for more than half the year.)

Tuesday, April 07, 2026

CSR forgone: Long- and short-term changes in the ACA marketplace

Note: Free xpostfactoid subscription is available on Substack alone, though I will continue to cross-post on this site. If you're not subscribed, please visit xpostfactoid on Substack and sign up. 

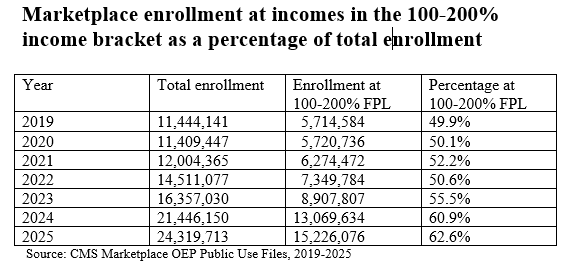
When considering how the most seismic changes in the ACA marketplace’s 13-year history have shaken out, it’s important to keep in mind that the market mainly serves very low-income people. Consider*:

  • 64% of all marketplace enrollees in 2026 had income in the 100-200% FPL range. In the U.S. population at large, just 15% were in that income range as of 2024.

  • 54% of all marketplace enrollment (12,487,037) in 2026 is in ten states that have refused to enact the ACA Medicaid expansion, where eligibility for marketplace subsidies begins at 100% FPL. In expansion states, Medicaid is available to all adult citizens and qualified noncitizens with income up to 138% FPL.

  • More than half of enrollment in nonexpansion states (6,543,435) is in an income bracket (100-138% of the Federal Poverty Level, or FPL) that would qualify those enrollees for Medicaid in expansion states. Those should-be-in-Medicaid enrollees account for 28% of all marketplace enrollment.

  • In 2026, 83% of silver plan enrollees nationally had income in the 100-200% FPL range, qualifying them for strong Cost Sharing Reduction (CSR) that raises the actuarial value (AV) of a silver plan to 94% (at incomes up to 150% FPL) or 87% (at income from 150-200% FPL). Nationally, the average AV obtained by silver plan enrollees was 88.6%, justifying the presumption now enforced by several states that silver plans should be priced at a roughly platinum level (90% AV), well above gold (80% AV).

With that low-income skew in mind, I’d like to examine both long-term enrollment trends and shifts in metal selection in 2026, the latter driven mainly (presumably) by expiration of the enhanced ARPA subsidies.

Trends include:

Sunday, March 29, 2026

ACA Marketplace 2026: The downshift to bronze

Note: Free xpostfactoid subscription is available on Substack alone, though I will continue to cross-post on this site. If you're not subscribed, please visit xpostfactoid on Substack and sign up.

Charles Gaba, via a trick that presents itself to the highly motivated, has got hold of the 2026 Public Use Files (PUFs) for the ACA marketplace before they’re officially announced and has parsed them 26 ways. He’s also kindly shared the trick, and so the file.

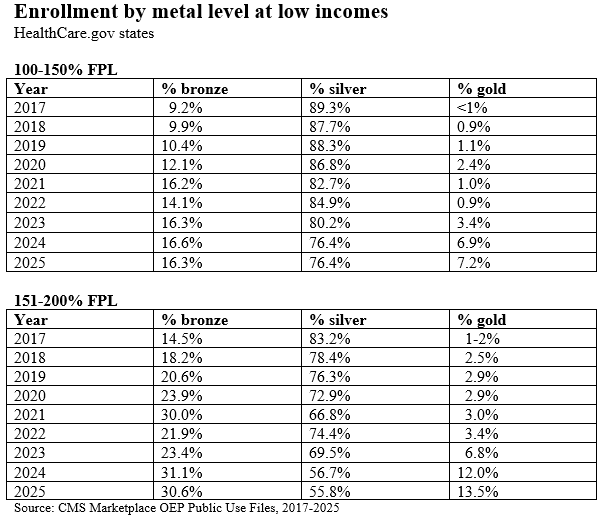
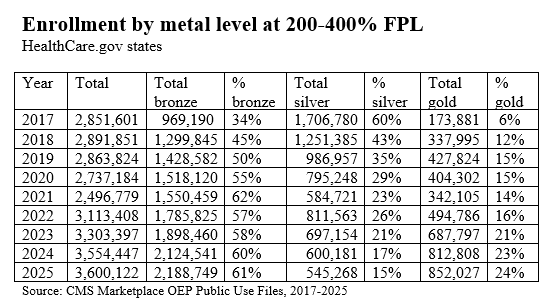
I want to continue my focus on the degradation of coverage — that is, the shift to lower metal levels, and in particular, the shift away from silver among those eligible for strong Cost Sharing Reduction (CSR), which raises the actuarial value of a silver plan from a baseline of 70% to 94% (at incomes up to 150% of the Federal Poverty level) or 87% (for those in the 150-200% FPL) range.*

For starters, here is the metal level breakdown for all states in 2025 vs. 2026.

Accelerating a multi-year trend, silver selection fell sharply. a shift modestly offset by an increase in gold selection, as three states (Washington, Arkansas, Illinois) newly implemented strict silver loading in 2026, rendering gold plans less expensive than silver (in Illinois and Arkansas, 31% of enrollees selected gold plans, and in Washington, 51% selected gold).

Monday, February 02, 2026

How much will average monthly enrollment drop in the ACA marketplace in 2026?

Note: Free xpostfactoid subscription is available on Substack alone, though I will continue to cross-post on this site. If you're not subscribed, please visit xpostfactoid on Substack and sign up.

Downhill slope: gradual or steep?

While the ACA marketplace’s Open Enrollment Period (OEP) for 2026 is wrapping up with a relatively modest drop of about 5% from OEP 2025, marketplace observers expect the losses to deepen as the year progresses. That’s primarily for two reasons: 1) most subsidized enrollees are facing steep premium increases because the enhanced subsidies funded through 2025 have not been extended, and 2) a June 2025 CMS rule effectively ratified in HR1, the Republican megabill enacted last July, ended year-round enrollment for low-income enrollees.

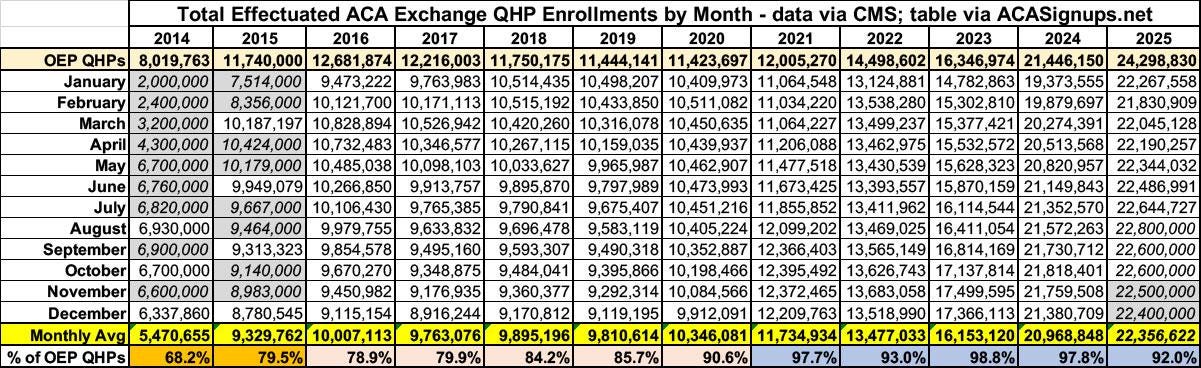
The most complete measure of enrollment in a given year is average monthly enrollment (AME), which takes into account both retention and the conditions under which people enroll when OEP is finished. The gap between enrollment* totals as of the end of OEP and AME has varied considerably over the marketplace’s 13-year existence. To scope out the likely range of enrollment losses through the full 2026 plan year, Charles Gaba has tabulated the OEP-AME gap for every plan year through 2025.

The gap shrank during the first Trump administration, both because enrollment barriers the administration threw up (shortened OEP, sharply reduced funding for enrollment assistance and marketing) weeded out less motivated enrollees, and because the advent of silver loading after Trump cut off direct CSR payments to insurers made zero-premium coverage newly available to millions, and people don’t tend to drop zero-premium coverage. The gap shrank further during the Biden years, as the enhanced premium subsidies enacted in March 2021 as part of the American Rescue Plan Act (ARPA) further expanded the availability of zero-premium (and low-premium) coverage, and as year-round enrollment for enrollees with income under 150% FPL was implemented in early 2022. (In 2025, 47% of all enrollment was at incomes below the 150% FPL threshold.) The Medicaid unwinding — that is, the resumption of Medicaid redeterminations and disenrollments in spring 2023 after a 3-year pandemic induced moratorium — reduced the OEP-AME gap to near-nothing in 2023 and 2024, as millions transitioned from Medicaid to the marketplace.


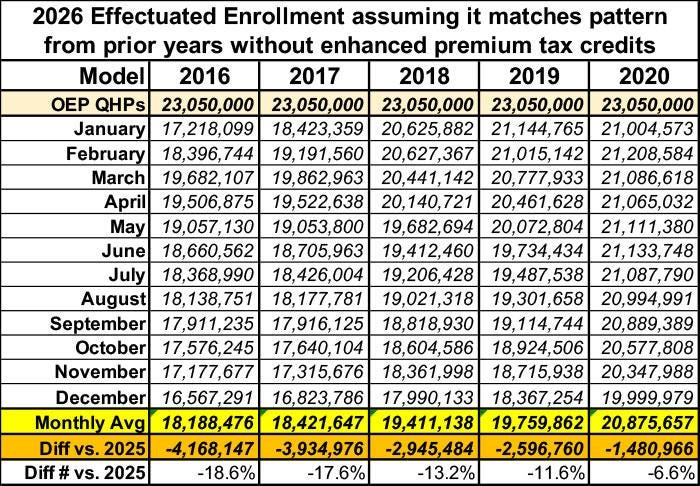
Gaba further uses the OEP/AME ratios in the pre-ARPA years to project a range of possible enrollment losses in 2026:

Of course we can’t know whether enrollment losses will be within this range. There are reasons to believe that attrition will exceed the 2016 peak (excluding 2014, when the marketplace was immature), but there are also mitigating factors. Let’s look at both sides of the equation.

Factors that may trigger major attrition

  1. Unprecedented net-of-subsidy premium hikes. Prior to OEP 2026, marketplace premium subsidies have never lost value (or rather, never lost more than a few of tenths of a percentage point, as the “applicable percentages” of income required for a benchmark silver plan at each income level were adjusted modestly for inflation in the years prior to enactment of the enhanced subsidies, and again in 2026). By KFF’s estimate, in 2026, net-of-subsidy premiums for a benchmark silver plan rose by an average of114% for the 92% of 2025 enrollees who were subsidy-eligible.

  2. Increased auto-reenrollment. In HealthCare.gov states, passive auto-reenrollment spiked from 30% of reenrollments in 2024 to 46% in 2025 (see public use files here). Many of those auto reenrollees may be unaware of the degree to which their premiums have spiked in 2026 (not only because of reduced subsidies, but because of annual shifts in the benchmark plan and its premium). If many of the auto-reenrollees have incomes below 150% FPL (as did more than half of enrollees in HealthCare.gov states in 2025), they will also have lost the ability to switch to a less expensive plan when they discover the premium spike. Which brings back to…

  3. No more monthly SEPs at low incomes. In February 2022, the Biden administration implemented a monthly Special Enrollment Period (SEP) for enrollees with income up to 150% FPL, for whom the enhanced subsidies created in March 2021 had rendered benchmark silver coverage free. Year-round SEPs have given average monthly enrollment a major boost, as Gaba’s tables show (2021 enrollment was boosted by a six-month SEP for all comers in the wake of the enhanced subsidies enacted in March of that year). As noted above, the year-round SEP also enabled passive reenrollees stung by an unexpected premium hike to switch into a less expensive plan. The current Trump administration ended the monthly SEP by administrative rule, effective last August, and the HR1 megabill effectively codified the rule by making subsidies unavailable for SEPs granted on the basis of low income.

  4. SEP verification. CMS’s Program Integrity Rule finalized in June 2025 tightened verification requirements for life changes (such as loss of employment) that trigger a SEP, requiring verification for 75% of SEPs beginning in 2026.

Factors that may mitigate attrition

  1. Silver loading. After Trump abruptly cut off direct reimbursement of insurers for the Cost Sharing Reduction (CSR) subsidies that attach to silver plans for low-income enrollees, most states allowed or encouraged insurers to price CSR directly into silver plans only. That raised benchmark premiums and therefore subsidies and raised the premiums for silver plans relative to bronze and gold plans, as CSR makes silver plans roughly platinum-equivalent for enrollees with income up to 200% FPL (i.e., for most silver plan enrollees). Silver loading made zero-premium bronze plans available to millions more enrollees than previously, boosting not only enrollment (by perhaps 5% in 2019) but retention. Logically speaking, silver loading should have made gold plans consistently cheaper than silver plans, as CMS noted in a December 2015 memo. While that did not happen, as insurers have various incentives to underprice silver plans, over time an increasing number of states have mandated more strict silver loading - -and in some cases, most notably in Texas — required insurers to price silver plans as if they are platinum (Arkansas, Illinois and Washington did this in advance of OEP 2026). Silver loading’s impact on gold premiums is consequently more intense in 2026 than in Trump 1.0 years — when, per Gaba’s table above, those effects probably had a major role in reducing attrition. In 2018, the average lowest-cost gold premium nationally was 109% of the benchmark (second cheapest) silver premium, whereas in 2026, lowest-cost gold on average is 98% of the benchmark. Cheap gold plans will have a particularly strong effect in Texas, where $0 premium gold plans will be available to about 2.5 million enrollees with income under 150% FPL, and to many older enrollees with income near 200% FPL. Zero premium bronze plans will be available to far more enrollees than that.

  2. Broker participation and public awareness. In the pre-ARPA era, when marketplace AME was stuck at around 10 million, the marketplace was hampered not only by subsidies that many found inadequate but also by widespread ignorance of marketplace offerings. For years, enrollment assistors told me that many people thought the program had been repealed (even in 2024), and Republican hostility to “Obamacare” remained a factor. While the first Trump administration did gut funding for nonprofit enrollment assistance, however, it also encouraged and marketed broker participation and continued the development of commercial e-broker platforms (a.k.a. enhanced direct enrollment, or EDE, platforms) that make brokers’ jobs much easier. As enrollment soared after the ARPA subsidies were implemented, so did broker participation, rising from 49,000 in 2018 to 83,000 in early 2024. While brokers’ too-easy access to enrollees’ accounts via EDE platforms sparked a plague of fraud and low-quality brokerage, broker outreach plainly reached deep into low-income areas, particularly in states that had refused to expand Medicaid, where marketplace subsidy eligibility begins at incomes of 100% FPL, as opposed to 138% FPL in expansion states (and again, CSR-enhanced silver coverage was available for free at incomes up to 150% FPL). In addition to providing sometimes-expert help, brokers have a strong motive to keep clients enrolled, and they have likely steered many clients into lower-premium plans to mitigate the impact of average net-of-subsidy premium hikes. In 2024, about 80% of enrollments in HealthCare.gov states were broker-assisted.

  3. Habit. Coverage is tough to lose, and about 12 million more people signed up for marketplace coverage in OEP 2025 than in OEP 2020. While many may drop coverage as higher premiums bite — or as they try to use plans with $8,000 deductibles — many more will do what they can stay covered.

So there you have it. I’m not going to venture a prediction. We’ll have a better sense of what AME is likely to look like when the first effectuated enrollment snapshot, showing paid-up enrollment as of February, is published in June or July. But that snapshot will not show the coverage drop for re-enrollees who have not paid their first premium, as enrollees are generally granted a 3-month grace period. CMS is currently publishing effectuated enrollment with a three-month lag as part of its monthly snapshots of Medicaid/CHIP enrollment, so we may have a clearer picture by June or July (a half-year effectuated enrollment snapshot usually comes out in the fall). Full AME for 2026 won’t be published until mid-2027, if current practice holds. But who knows where this country — and the marketplace — will be by then.

P.S. Any measure of coverage losses in the post-ARPA era (if it lasts more than a few weeks or months) should incorporate a loss in average actuarial value, as low-income enrollees exchange high-CSR silver for bronze or even gold plans. See my post on a proposed measure: Total AV for the whole marketplace. 

- - -

*Technically, “plan selections” tallied as of the end of OEP are not “enrollments,” as some will never be effectuated.

Thanks for reading xpostfactoid! Subscribe for free:


Friday, January 09, 2026

A new measure of pending marketplace degradation

Note: Free xpostfactoid subscription is available on Substack alone, though I will continue to cross-post on this site. If you're not subscribed, please visit xpostfactoid on Substack and sign up.

Will Plan Year 2025 forever be Obamacare's Babe Ruth? 

Charles Gaba has issued a timely warning that most of the enrollment loss in the ACA marketplace this year, resulting from expiration (so far) of the enhanced premium subsidies funded only through 2025, will only be evident after CMS releases its first snapshot of effectuated coverage — that is, paid-for coverage. Thanks to auto re-enrollment, enrollment losses will look relatively slight (perhaps minus 1 million) as of the end of the Open Enrollment Period.

Republicans will make hay of this — claiming, as CMS did, that the subsidy reduction is not so catastrophic for the 93% of enrollees subsidized in 2025 who will remain subsidy eligible in 2026. And CMS’s annual snapshot of coverage effectuated as of Feb. 1 typically doesn’t appear until June or July. At that politically distant point, much more of the fallout from expiration of the enhanced subsidies will become visible.

In 2024 and 2025, early effectuated coverage exceeded 95% of end-of-OEP enrollment, whereas in 2016, it was just 85%. Retention improved during the first Trump administration, probably for reasons including 1) a shortened Open Enrollment period and cuts to funding for enrollment assistance and outreach, which likely discouraged more marginal enrollees from enrolling at all, and 2) Trump’s cutoff in October 2017 of direct reimbursement of insurers for the Cost Sharing Reduction (CSR) subsidies that attach to silver plans at low incomes, which triggered silver loading (the pricing of CSR into silver plan premiums) and increased the number of enrollees paying zero or very low premium. Retention increased further after the enhanced subsidies enacted by the American Rescue Plan Action March 2021 made zero-premium coverage much more widely available — to the point where, in 2025, about a third of all enrollees paid zero premium.

There’s reason to believe that massive sticker shock when the first 2026 premium bills arrive — with subsidized premiums for a benchmark silver plan more than doubling on average from 2025 to 2026 — will drive the ratio between OEP enrollment and February effectuated enrollment back to Obama-era levels this year, or even lower. Further, since Republicans have terminated year-round enrollment for enrollees with income below 150% FPL, average monthly enrollment in 2026 will drop even further compared to 2025. That change won’t be evident until mid-year 2027.

Read Gaba on this. He’s sharp on the political ironies (with advocates of the enhanced subsidies now echoing Republicans’ 2014 cry of “but how many have paid?” as the ACA’s first enrollment period wound down), and he roughs out credible estimates, roughly matching CBO’s, of enrollment losses in 2026 as reflected in average monthly enrollment (about 4 million). What I want to do here is consider another important effect of reduced subsidies: The likelihood that many who remain enrolled will downgrade their coverage to reduce their premiums. How might we measure the combined effects of increased uninsurance and increased under-insurance?

To get a grip on any future degradation of coverage obtained in the marketplace, we can use actuarial value (AV) — in combination with effectuated enrollment. AV is the percentage of the average enrollee’s costs a plan is designed to cover, calculated according to a formula created by CMS.*


Average weighted AV in the entire national marketplace has been stable over the years at 78-79% (compared to about 84% in employer-sponsored coverage), though the factors determining the average have been quite volatile. More on that stability/volatility below. If the enhanced subsidies are not renewed, I believe average AV as well as total enrollment will drop in 2026 and years following. To get a sense of the effects of dropped coverage and degraded coverage, I propose a measure something like “OPS” in baseball — a combination of on-base percentage and slugging percentage. The measure would simply be “Total AV” — total enrollment times average weighted actuarial value. The best measure of total enrollment, although it entails an 18-month data lag (under current practice), would be average monthly enrollment. An alternative measure, available roughly six months after the end of each OEP, would be early effectuated enrollment (as of February).

In 2025, we have a figure for average monthly enrollment through September**: 22.4 million (22,356,622). As Republicans terminated year-round enrollment at low incomes (implemented by the Biden administration) as of August, there will probably be a slight drop in the full year total, when available, to perhaps 22.3 million. Average weighted AV was 79.0% (Total AV calculations require a bit of extrapolation, outlined in a note at bottom, from the Public Use Files published by CMS). Total AV for the marketplace in 2025 will thus be about 18.4 million — probably a permanent all-time high, if the enhanced subsidies are not restored.

Taking expected increased attrition into account, Gaba estimates that average monthly enrollment will drop to about 18.5 million in 2026. That’s a 17% drop from 22.3 million in 2025. If weighted average AV drops, say, from 79% to 75%, Total AV in 2026 will be 13.9 million— a 24% drop. That’s a fuller measure of what may be lost.

Average weighted AV: Stable in aggregate, volatile in composition

As to the shifting composition of average weighted AV in the ACA marketplace over the years: The chief source of high-AV coverage in the marketplace is the Cost Sharing Reduction (CSR) that attaches to silver plans at low incomes, raising a silver plan’s AV to 94% at incomes up to 150% of the Federal Poverty Level and to 87% at incomes in the 150-200% FPL range — compared to 60% for bronze and 80% for gold. Over the years, silver plan selection at low incomes (those eligible for strong CSR) has eroded steadily, but the percentage of enrollees with income below 200% FPL has risen sharply. (A weak CSR is available in the 200-250% FPL bracket, raising AV to 73% . AV for silver plans without CSR is 70%.)

First, look at the rate of silver selection at the two highest CSR levels from 2017-2025. This is only in HealthCare.gov states, as in early years CMS data for state-based marketplaces was much less complete. Over this period, the number of states using the federal exchange dropped from 39 to 30. At the same time, all states that have refused to enact the ACA Medicaid expansion (excepting Idaho until 2020) used the federal exchange throughout these years, ensuring that enrollment in the 100-150% FPL income bracket has always been concentrated in HealthCare.gov states (In 2025, when just 30 states used HealthCare.gov, 85% of enrollees at 100-150% FPL were in Healthcare.gov states).

While silver selection at incomes where strong CSR (94% or 87% AV) is available has dropped, the percentage of enrollees at incomes below 200% FPL has risen steadily since 2019 (the first year in which CMS provided income breakouts for all states).

The percentage of all enrollees who obtained CSR hit an all-time high in 2017 at 57%, dipped to 53% in 2018 (the first year when silver loading went into effect), and was 53% in 2025. But not all CSR is created equal, and in the silver loading era, silver selection in the 200-250% FPL bracket, where CSR raises AV to just 73%, fell off a cliff. In 2017, in HealthCare.gov states, 16% of silver selection at CSR-eligible incomes was in the 200-250% FPL bracket; in 2025, that percentage was down to 3.5%. Conversely, in 2025 78% CSR enrollment was in the 100-150% FPL bracket, compared 52% in 2017. In 2025, in HealthCare.gov states, 41% of all enrollees — 7 million out of 17.1 million — obtained CSR with a 94% AV.

A word about enrollment at income below 100% FPL, the income threshold below which marketplace subsidies are unavailable for citizens. CMS did not break out this income bracket until 2022. In 2025, there were 548,650 enrollees in the under-100% FPL bracket, 2.2% of all enrollment. Most of them were lawfully present noncitizens subject to the “5-year bar” to Medicaid eligibility to which U.S. law subjects noncitizens. The ACA stipulates that immigrants subject to the 5-year bar are subsidy-eligible in the marketplace even if their income is below 100% FPL. But the Republicans’ vile megabill enacted this summer stripped out this eligibility as of Jan. 1, 2026. CBO estimates that about 300,000 immigrants will lose coverage as a result — and most of them were probably enrolled in high-CSR silver. That’s one more ding to average AV (as well as enrollment) in 2026 and years following, even if the enhanced subsidies are extended.

The other major change in the distribution of AV over the years derives from silver loading — the pricing of CSR directly into silver plan premiums, adhered to in varying degrees in different states and rating areas, or by different insurers within states and rating areas. Because ACA premium subsidies are designed so that enrollees pay a fixed percentage of income (varying by income bracket) for the benchmark (second-cheapest) silver plan, when silver premiums rise, so do subsidies, and so do “spreads” between the benchmark silver plan and cheaper plans — e.g., most bronze plans, and in some states, many or most gold plans. Since insurers tend for competitive reasons to underprice silver plans (as silver remains the dominant metal level, since most enrollees qualify for strong CSR), an increasing number of states are mandating that insurers price plans in strict proportion to actuarial value. Since silver plans, enhanced by CSR for most enrollees, have higher AV than gold plans, gold plans should be cheaper than silver - -and in 20 states in 2026, lowest-cost gold plans are on average priced at premiums below that of the silver benchmark.

Weak or strong silver loading has been in place in almost all states since 2018, and as a result, silver plan selection has collapsed at incomes over 200% FPL (where CSR is weak or unavailable) as well as eroding at incomes under 200% FPL. Note above that gold plan selection as well as bronze plan selection has increased at low incomes. Much of the gold selection increase is concentrated in Texas, where gold plans are far cheaper than silver. In 2025, almost 900,000 Texas enrollees with income under 200% FPL enrolled in gold plans. That’s about 6% of all enrollees with income under 200% FPL nationwide.

Low-income enrollees who select gold plans are giving up AV, often in exchange for a reduced premium (e.g., to obtain coverage from an insurer whose silver plan is priced above benchmark). The difference in AV is reflected most dramatically in the annual out of pocket maximum .By statute, out-of-pocket maximums are capped at a much lower level for CSR-enhanced silver plans available to those with income under 200% FPL than for all other plans, including gold. In 2026, the highest allowable OOP max for silver plans at incomes up to 200% FPL is $3,500, compared to $10,600 for other metal levels. For enrollees with income below 150% FPL, silver OOP maxes are usually far lower than $3,500, averaging $1,738 in 2026, according to KFF.

At incomes over 200% FPL, the window in which the premium difference between silver plans and bronze plans is worth the higher AV provided by silver plans is very narrow — and again, in many states, at least some gold plans are cheaper than benchmark silver. Silver selection at incomes over 200% FPL has appropriately collapsed. Here is the breakout in HealthCare.gov states:

With respect to average weighted AV, the increase in gold selection in this income bracket only partly offsets the larger increase in bronze selection. But again, inflated silver premiums more often than not make bronze a better value than silver at incomes over 200% FPL.

Why enrollment has doubled and silver plan selection has diminished

The story of why enrollment surged after ARPA was enacted in March 2021 is in one sense straightforward: ARPA made high-CSR coverage free to enrollees with income up to 150% FPL, increased premium subsidies in every income bracket, and lifted the income cap on subsidy eligibility. But the story is somewhat complicated, for better and worse, by surging broker participation in those years. The number of brokers registered with HealthCare.gov rose from 49,000 in 2018 to 83,000 as of OEP for 2024. Since Americans remain persistently ignorant about what’s available in the marketplace until they need it, increased broker outreach was probably key to the doubling of enrollment in the post-ARPA era. At the same time, broker fraud also metastasized around 2023-2024. A CMS crackdown and rule-tightening has probably reduced such fraud but has not yet quelled it, to judge from broker discussion sites I tune into. Brokers enrolled probably some hundreds of thousands of people without their knowledge or consent — the totals are still unknown — and engaged in unauthorized plan switching — sometimes multiple times — for hundreds of thousands more. (The switching may have slightly pushed average AV down slightly, as fraudster brokers looked for zero-premium plans to switch enrollees into, and most of those would be bronze plans.)

The story of why silver selection has eroded at incomes under 200% FPL is more complicated. As more low-income enrollees have poured into the marketplace in the enhanced subsidy era, some may simply make mistakes. The number of available plans in each rating area has proliferated; the average enrollee is confronted with more than 100 choices. Most enrollments are broker-assisted, and there is a fair amount of low-quality and sometimes corrupt brokerage, though I know of no source or means to assess broker quality norms (a good broker is priceless, given our ridiculously complex marketplace, and there are plenty of good ones). At the same time, I have delved more than once into the probably-increasing incidence of enrollees choosing lower-AV coverage with eyes wide open, in order to obtain coverage from a plan with a more robust provider network or a formulary that covers the enrollee’s drugs. Competition has pushed the marketplace toward narrow networks, especially at the lowest premiums at each metal level, and that has probably induced more enrollees to trade AV for network or formulary quality.

In any case, expiration of the enhanced subsidies is likely to accelerate the erosion of CSR takeup. An option to take some or all of the premium subsidy as an HSA would of course further erode AV, trading first-dollar coverage for increased exposure to high out-of-pocket costs. Total AV for the marketplace is therefore likely to erode even faster than total enrollment if subsidies remain at current levels.

— — — — —

*AV is in one sense a misleading measure, in that the average is skewed by the small percentage of enrollees in any plan who incur very high costs (capped for the enrollee by the out-of-pocket maximum, which this year can be as high as $10,600). If your plan has an AV of 60% and covers essentially no costs before, say, an $8,500 deductible, but you’re in an accident and incur $100,000 in medical costs, if the out-of-pocket maximum is $10,000, 90% of your costs are covered. For many other enrollees in such a plan, AV may be effectively zero, even if they spend thousands of dollars out of pocket. That said, AV is a uniform measure that does indicate the relative value from year to year of marketplace coverage.

**See Gaba, who posts a table combining 6 months of effectuated enrollment for 2025 available here (find “January-July effectuated enrollment tables” for 2025) with August and September estimates provided in CMS’s monthly Medicaid and CHIP enrollment snapshots.

A note on average weighted AV calculations. The marketplace Public Use Files for 2022 through 2025 break out enrollment at each CSR level for HealthCare.gov states but not for all states. As a proxy, I used the breakouts of metal level enrollment by income in the “State, Metal Level and Enrollment Status” PUF, taking silver totals as a proxy for CSR levels, subtracting the difference between total CSR enrollment (provided for all states) and total silver enrollment at incomes from 0-200% FPL proportionately from each CSR bracket.
     For 2017, I had to get a bit more creative, as metal level selection by income was broken out only for HealthCare.gov states, though the PUF does show total silver enrollment in both HealthCare.gov states and SBM states. To estimate the distribution of silver selection by income in SBM states, I used the “SBM-FPs” — nominal state marketplaces using the federal exchange — as a proxy, since all four of those states had expanded Medicaid. I then calculated an average silver AV for HealthCare.gov states (84.6%) and SBM states (80.7%) and used those averages for total silver enrollment in each of the two categories.

Edited 1/9/25 -- including correction of a typo regarding avg. monthly enrollment in 2025 (estimated at 22.3 million, not 23.3 million).

Thanks for reading xpostfactoid! Subscribe for free:


Public domain image: Wikimedia Commons


Thursday, January 01, 2026

Getting right-side of the newly restored ACA subsidy cliff

Note: Free xpostfactoid subscription is available on Substack alone, though I will continue to cross-post on this site. If you're not subscribed, please visit xpostfactoid on Substack and sign up.


Yesterday I came across a post by an Obamacare enrollee who in 2026 fell off the newly restored “subsidy cliff” -- the income threshold above which premium subsidies are once again unavailable.

As the Open Enrollment Period for 2026 continues through January 15 in the 30 states that use HealthCare.gov, and as late as January 31 in seven of the twenty state-based marketplaces, I thought (belatedly) that perhaps the info below might help some people take steps to remain subsidy-eligible — that is, to plan to take deductions that will get your income below the cap on subsidy eligibility.

Tuesday, December 16, 2025

Talking points for an electoral death march

Note: Free xpostfactoid subscription is available on Substack alone, though I will continue to cross-post on this site. If you're not subscribed, please visit xpostfactoid on Substack and sign up.

A man may smile, and smile (sort of)...

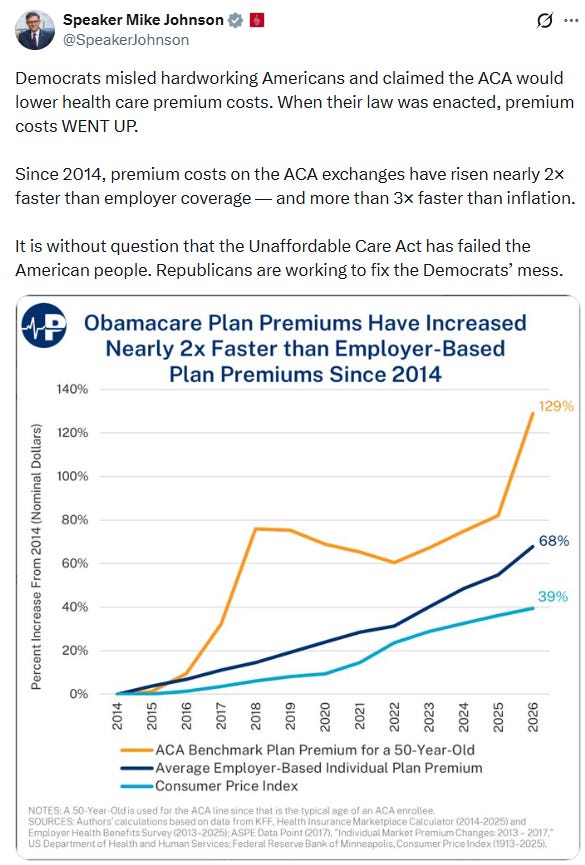
Multiple Republican senators and House reps, psyching themselves up for electoral suicide, are sharing this messaging from the Koch-funded Paragon Health Institute, where virtually all their ACA-related talking points originate:

There are of course lies, damned lies, statistics, and Koch-funded talking points designed to strip Americans of healthcare access to help fund tax cuts for the wealthy.

Look at the mid-section of Johnson chart above, from 2018 to 2025 (there should be a sharp spike from 2017 to 2018, but never mind). There is barely any premium increase in that long stretch, during which average premiums for employer-sponsored insurance rose far more quickly. Here is the comparison in the National Health Estimate Accounts, published in June of this year (see Table 17 in NHE Projections - Tables, here)


From 2018 through 2023, the last year for which the NHE has data, premiums in the individual market (“direct purchase” above) were up 13% — while premiums in the employer-sponsored market rose 29%. From 2023-2025, average ACA benchmark silver premiums rose 9% (from $456/month to $497/month), while average ESI premiums rose 11% (from $8,435/year to $9,325/year) for single coverage according to KFF’s annual employer benefits survey. As of 2025, ESI premiums remained considerably higher than marketplace premiums, though the difference is probably in line with differences in network quality and actuarial value (a measure of the level of out-of-pocket exposure).

Friday, November 21, 2025

The HOPE Act, extending enhanced ACA subsidies with a slight haircut, is cause for...hope

 Note: Free xpostfactoid subscription is available on Substack alone, though I will continue to cross-post on this site. If you're not subscribed, please visit xpostfactoid on Substack and sign up.

Pandora...don't ignore her

Picture yourself in a boat on a river, with tangerine trees, and a Republican party that grounds genuine fiscal conservatism (the kind that eschews multi-trillion-dollar tax cuts) in fact rather than in lies and fantasy. What might a compromise on extension of the enhanced premium subsidies in the ACA marketplace look like?

Stop presses: It might look like the bill put out by the Problem Solvers’ caucus today. (I mean ‘‘stop presses” literally, as I was sketching out my own compromise here when I came across the bill in question.)

The Healthcare Optimization Protection Extension (HOPE) Act (summary here, bill text here) was introduced today by Problem Solvers members Tom Suozzi (D-NY), Don Bacon (R-NE), Josh Gottheimer (D-NJ), and Jeff Hurd (R-CO). It addresses two legitimate concerns about the enhanced premiums subsidies (eAPTC) created by the American Rescue Plan Act and currently funded only through 2025: that they spend too much money subsidizing high-income enrollees (questionable, but not absurd), and that they opened an easy pathway to fraud (true, but only in concert with other factors that can be addressed to shut the fraud down).

The HOPE bill only lightly increases the premium burden at incomes over 600% of the Federal Poverty Level ($93,900 annually for an individual, $126,900 for a couple, $192,900 for a family of four). The subsidy “cliff” — the cap on eligibility — goes back in place, but rises from the pre-ARPA (and now pending) 400% FPL to 935% FPL. The new cliff will take a substantial bite from some pretty affluent individuals and families, as explored below, but the ranks of those affected are small.

Tuesday, November 18, 2025

100 Years of ACA Repeal

Note: Free xpostfactoid subscription is available on Substack alone, though I will continue to cross-post on this site. If you're not subscribed, please visit xpostfactoid on Substack and sign up.

Please, Sir, may I have my inadequate calorie ration up front?

In its initial lightly sketched form, Senator Bill Cassidy’s ACA reform plan is the least bad of several Republican proposals, in that it extends funding for the enhanced ACA premium subsidies (eAPTC) that will otherwise expire at the end of 2025, while redirecting them.

As outlined to the Washington Examiner, Cassidy’s proposal would end eAPTC but use the $26 billion estimated cost to fund Flexible Spending Accounts (FSAs) for subsidy-eligible ACA enrollees — that is, funds to spend directly on out-of-pocket costs (or other medical costs, e.g., dental). As Charles Gaba notes, it’s unclear whether each enrollee’s FSA would be funded with the amount of eAPTC she would have been eligible for, or whether the FSA would be flat-rate or allocated by some other formula. (Cassidy emphasizes that HRAs, unlike Health Savings Accounts, are use-it-or-lose it, saving the federal government money from enrollees who access little or no medical care in a year.)

The incentive for most enrollees would be strong to use their reduced premium subsidies to buy a bronze plan (average deductible about $7,400) and use the FSA to cover first-dollar expenses. That’s donut-hole coverage, as the FSA wouldn’t cover all expenses up to the deductible or annual out-of-pocket maximum (as high as $10,600). It would work for a lot of people, while leaving lots more who would otherwise have been in high-CSR silver (actuarial value 94% or 87%, in contrast to 60% for bronze) saddled with thousands more in out-of-pocket expense.

Friday, November 07, 2025

A tincture of gold mitigation in the 2026 ACA marketplace

 Note: Free xpostfactoid subscription is available on Substack alone, though I will continue to cross-post on this site. If you're not subscribed, please visit xpostfactoid on Substack and sign up.

Trumpcare 2.0 is also gold-laden

Amidst the carnage wrought by the (still reversible) expiration of the enhanced subsidies in the ACA marketplace, one substantial mitigating factor has emerged: silver loading has reached a milestone. While net-of-subsidy premiums for benchmark silver plans will more than double for the average subsidized enrollee, the average lowest-cost gold plan will be priced below the benchmark (second-cheapest) silver plan for the first time.

That average masks a ton of variation: the average lowest-cost gold plan is priced below benchmark in only 20 states. But those states include Texas and now Florida, which together accounted for more than a third of all enrollees nationally (8.7 million). In total, average lowest-cost gold plans have premiums below benchmark in 20 states with 12.7 million enrollees, 52% of all enrollees nationwide. (In another 12 states, lowest-cost gold premiums average less than 105% of benchmark premiums.)

Thanks for reading xpostfactoid! Subscribe for free:

Monday, November 03, 2025

CMS spin on the ACA marketplace, threaded through the Washington Post

Note: Free xpostfactoid subscription is available on Substack alone, though I will continue to cross-post on this site. If you're not subscribed, please visit xpostfactoid on Substack and sign up

To have or have not..or have a lot less

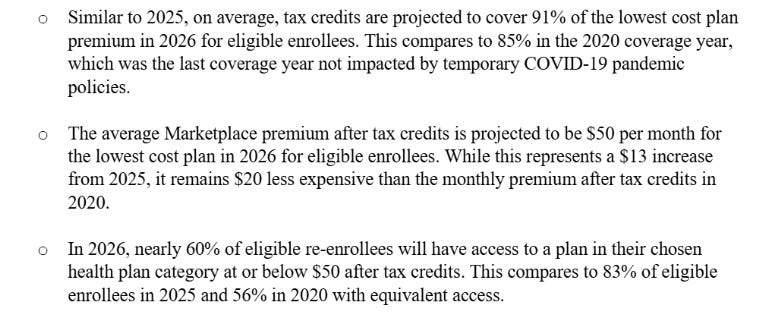
My last post delved into CMS’s spin on the expiring enhanced ACA subsidies — that is, the agency’s focus on a) the comparatively modest increase in subsidized enrollees’ premiums for the lowest-cost bronze plan available in 2026 (up a mere 35%, compared to the 114% increase for benchmark silver calculated by KFF) and b) on a relative reduction in the lowest-cost bronze premium compared to 2020 (seven OEPs ago!).

I am sorry to see this distorted frame adopted in the Washington Post by a veteran ACA reporter, Paige Cunningham. The article is not factually inaccurate (though I can’t quite make some of the premium quotes work), but it downplays the impact of expiration of the enhanced subsidies on those who remain subsidized.

Here are the select facts Cunningham reports through the CMS filter:

Wednesday, October 29, 2025

CMS: Buy the cheapest plan, and these subsidy cuts will only hurt a little

Note: Free xpostfactoid subscription is available on Substack alone, though I will continue to cross-post on this site. If you're not subscribed, please visit xpostfactoid on Substack and sign up

Heavy OOP burden 


You may have read KFF’s estimate that the average subsidized 2025 enrollee in the ACA marketplace will pay 114% more* for a benchmark silver plan in 2026, if the enhanced subsidies funded only through 2025 are allowed to expire. True!

You may also have read estimates that base (unsubsidized) premiums will rise 25% (from Charles Gaba) or 26% (from KFF). Also true!

Now, as of today, you may read CMS’s proud assurance (via https://www.axios.com/2025/10/28/trump-open-enrollment-premium-prices-health-care-government-shutdownAxios) that things are not so bad:

These claims are doubtless also true! How can that be? Are premiums for subsidized enrollees going up 114% — or 35%? (i.e. from $37 to $50/month, per CMS**).

It depends, of course, on the plan you’re buying and what percentage of your actual medical claims it will cover. The KFF estimate is for the benchmark (second cheapest) plan — the one for which all subsidy-eligible enrollees pay a fixed percentage of income, which is being sharply reduced. The actuarial value of a silver plan varies with income, but for most enrollees it’s 94% or 87% (ratcheting down to 73% or 70% at income above 200% of the Federal Poverty Level (FPL).