Showing posts with label actuarial value. Show all posts

Sunday, March 29, 2026

ACA Marketplace 2026: The downshift to bronze

Note: Free xpostfactoid subscription is available on Substack alone, though I will continue to cross-post on this site. If you're not subscribed, please visit xpostfactoid on Substack and sign up.

Charles Gaba, via a trick that presents itself to the highly motivated, has got hold of the 2026 Public Use Files (PUFs) for the ACA marketplace before they’re officially announced and has parsed them 26 ways. He’s also kindly shared the trick, and so the file.

I want to continue my focus on the degradation of coverage — that is, the shift to lower metal levels, and in particular, the shift away from silver among those eligible for strong Cost Sharing Reduction (CSR), which raises the actuarial value of a silver plan from a baseline of 70% to 94% (at incomes up to 150% of the Federal Poverty level) or 87% (for those in the 150-200% FPL) range.*

For starters, here is the metal level breakdown for all states in 2025 vs. 2026.

Accelerating a multi-year trend, silver selection fell sharply. a shift modestly offset by an increase in gold selection, as three states (Washington, Arkansas, Illinois) newly implemented strict silver loading in 2026, rendering gold plans less expensive than silver (in Illinois and Arkansas, 31% of enrollees selected gold plans, and in Washington, 51% selected gold).

Friday, January 09, 2026

A new measure of pending marketplace degradation

Note: Free xpostfactoid subscription is available on Substack alone, though I will continue to cross-post on this site. If you're not subscribed, please visit xpostfactoid on Substack and sign up.

Will Plan Year 2025 forever be Obamacare's Babe Ruth? 

Charles Gaba has issued a timely warning that most of the enrollment loss in the ACA marketplace this year, resulting from expiration (so far) of the enhanced premium subsidies funded only through 2025, will only be evident after CMS releases its first snapshot of effectuated coverage — that is, paid-for coverage. Thanks to auto re-enrollment, enrollment losses will look relatively slight (perhaps minus 1 million) as of the end of the Open Enrollment Period.

Republicans will make hay of this — claiming, as CMS did, that the subsidy reduction is not so catastrophic for the 93% of enrollees subsidized in 2025 who will remain subsidy eligible in 2026. And CMS’s annual snapshot of coverage effectuated as of Feb. 1 typically doesn’t appear until June or July. At that politically distant point, much more of the fallout from expiration of the enhanced subsidies will become visible.

In 2024 and 2025, early effectuated coverage exceeded 95% of end-of-OEP enrollment, whereas in 2016, it was just 85%. Retention improved during the first Trump administration, probably for reasons including 1) a shortened Open Enrollment period and cuts to funding for enrollment assistance and outreach, which likely discouraged more marginal enrollees from enrolling at all, and 2) Trump’s cutoff in October 2017 of direct reimbursement of insurers for the Cost Sharing Reduction (CSR) subsidies that attach to silver plans at low incomes, which triggered silver loading (the pricing of CSR into silver plan premiums) and increased the number of enrollees paying zero or very low premium. Retention increased further after the enhanced subsidies enacted by the American Rescue Plan Action March 2021 made zero-premium coverage much more widely available — to the point where, in 2025, about a third of all enrollees paid zero premium.

There’s reason to believe that massive sticker shock when the first 2026 premium bills arrive — with subsidized premiums for a benchmark silver plan more than doubling on average from 2025 to 2026 — will drive the ratio between OEP enrollment and February effectuated enrollment back to Obama-era levels this year, or even lower. Further, since Republicans have terminated year-round enrollment for enrollees with income below 150% FPL, average monthly enrollment in 2026 will drop even further compared to 2025. That change won’t be evident until mid-year 2027.

Read Gaba on this. He’s sharp on the political ironies (with advocates of the enhanced subsidies now echoing Republicans’ 2014 cry of “but how many have paid?” as the ACA’s first enrollment period wound down), and he roughs out credible estimates, roughly matching CBO’s, of enrollment losses in 2026 as reflected in average monthly enrollment (about 4 million). What I want to do here is consider another important effect of reduced subsidies: The likelihood that many who remain enrolled will downgrade their coverage to reduce their premiums. How might we measure the combined effects of increased uninsurance and increased under-insurance?

To get a grip on any future degradation of coverage obtained in the marketplace, we can use actuarial value (AV) — in combination with effectuated enrollment. AV is the percentage of the average enrollee’s costs a plan is designed to cover, calculated according to a formula created by CMS.*


Average weighted AV in the entire national marketplace has been stable over the years at 78-79% (compared to about 84% in employer-sponsored coverage), though the factors determining the average have been quite volatile. More on that stability/volatility below. If the enhanced subsidies are not renewed, I believe average AV as well as total enrollment will drop in 2026 and years following. To get a sense of the effects of dropped coverage and degraded coverage, I propose a measure something like “OPS” in baseball — a combination of on-base percentage and slugging percentage. The measure would simply be “Total AV” — total enrollment times average weighted actuarial value. The best measure of total enrollment, although it entails an 18-month data lag (under current practice), would be average monthly enrollment. An alternative measure, available roughly six months after the end of each OEP, would be early effectuated enrollment (as of February).

In 2025, we have a figure for average monthly enrollment through September**: 22.4 million (22,356,622). As Republicans terminated year-round enrollment at low incomes (implemented by the Biden administration) as of August, there will probably be a slight drop in the full year total, when available, to perhaps 22.3 million. Average weighted AV was 79.0% (Total AV calculations require a bit of extrapolation, outlined in a note at bottom, from the Public Use Files published by CMS). Total AV for the marketplace in 2025 will thus be about 18.4 million — probably a permanent all-time high, if the enhanced subsidies are not restored.

Taking expected increased attrition into account, Gaba estimates that average monthly enrollment will drop to about 18.5 million in 2026. That’s a 17% drop from 22.3 million in 2025. If weighted average AV drops, say, from 79% to 75%, Total AV in 2026 will be 13.9 million— a 24% drop. That’s a fuller measure of what may be lost.

Average weighted AV: Stable in aggregate, volatile in composition

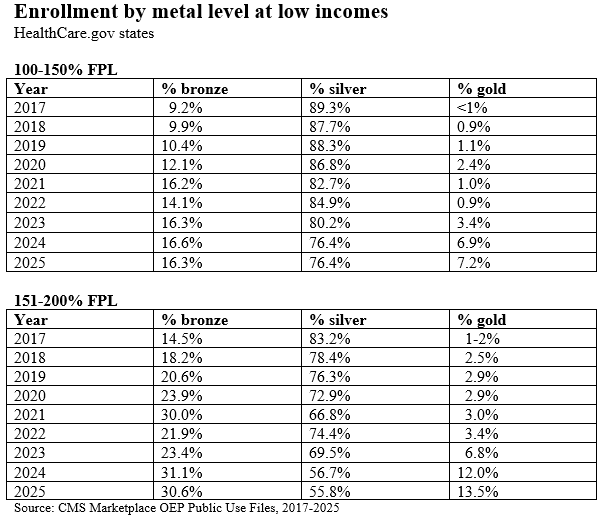
As to the shifting composition of average weighted AV in the ACA marketplace over the years: The chief source of high-AV coverage in the marketplace is the Cost Sharing Reduction (CSR) that attaches to silver plans at low incomes, raising a silver plan’s AV to 94% at incomes up to 150% of the Federal Poverty Level and to 87% at incomes in the 150-200% FPL range — compared to 60% for bronze and 80% for gold. Over the years, silver plan selection at low incomes (those eligible for strong CSR) has eroded steadily, but the percentage of enrollees with income below 200% FPL has risen sharply. (A weak CSR is available in the 200-250% FPL bracket, raising AV to 73% . AV for silver plans without CSR is 70%.)

First, look at the rate of silver selection at the two highest CSR levels from 2017-2025. This is only in HealthCare.gov states, as in early years CMS data for state-based marketplaces was much less complete. Over this period, the number of states using the federal exchange dropped from 39 to 30. At the same time, all states that have refused to enact the ACA Medicaid expansion (excepting Idaho until 2020) used the federal exchange throughout these years, ensuring that enrollment in the 100-150% FPL income bracket has always been concentrated in HealthCare.gov states (In 2025, when just 30 states used HealthCare.gov, 85% of enrollees at 100-150% FPL were in Healthcare.gov states).

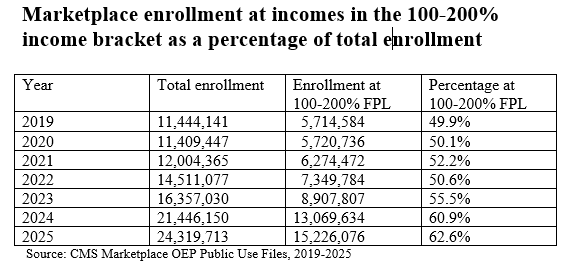
While silver selection at incomes where strong CSR (94% or 87% AV) is available has dropped, the percentage of enrollees at incomes below 200% FPL has risen steadily since 2019 (the first year in which CMS provided income breakouts for all states).

The percentage of all enrollees who obtained CSR hit an all-time high in 2017 at 57%, dipped to 53% in 2018 (the first year when silver loading went into effect), and was 53% in 2025. But not all CSR is created equal, and in the silver loading era, silver selection in the 200-250% FPL bracket, where CSR raises AV to just 73%, fell off a cliff. In 2017, in HealthCare.gov states, 16% of silver selection at CSR-eligible incomes was in the 200-250% FPL bracket; in 2025, that percentage was down to 3.5%. Conversely, in 2025 78% CSR enrollment was in the 100-150% FPL bracket, compared 52% in 2017. In 2025, in HealthCare.gov states, 41% of all enrollees — 7 million out of 17.1 million — obtained CSR with a 94% AV.

A word about enrollment at income below 100% FPL, the income threshold below which marketplace subsidies are unavailable for citizens. CMS did not break out this income bracket until 2022. In 2025, there were 548,650 enrollees in the under-100% FPL bracket, 2.2% of all enrollment. Most of them were lawfully present noncitizens subject to the “5-year bar” to Medicaid eligibility to which U.S. law subjects noncitizens. The ACA stipulates that immigrants subject to the 5-year bar are subsidy-eligible in the marketplace even if their income is below 100% FPL. But the Republicans’ vile megabill enacted this summer stripped out this eligibility as of Jan. 1, 2026. CBO estimates that about 300,000 immigrants will lose coverage as a result — and most of them were probably enrolled in high-CSR silver. That’s one more ding to average AV (as well as enrollment) in 2026 and years following, even if the enhanced subsidies are extended.

The other major change in the distribution of AV over the years derives from silver loading — the pricing of CSR directly into silver plan premiums, adhered to in varying degrees in different states and rating areas, or by different insurers within states and rating areas. Because ACA premium subsidies are designed so that enrollees pay a fixed percentage of income (varying by income bracket) for the benchmark (second-cheapest) silver plan, when silver premiums rise, so do subsidies, and so do “spreads” between the benchmark silver plan and cheaper plans — e.g., most bronze plans, and in some states, many or most gold plans. Since insurers tend for competitive reasons to underprice silver plans (as silver remains the dominant metal level, since most enrollees qualify for strong CSR), an increasing number of states are mandating that insurers price plans in strict proportion to actuarial value. Since silver plans, enhanced by CSR for most enrollees, have higher AV than gold plans, gold plans should be cheaper than silver - -and in 20 states in 2026, lowest-cost gold plans are on average priced at premiums below that of the silver benchmark.

Weak or strong silver loading has been in place in almost all states since 2018, and as a result, silver plan selection has collapsed at incomes over 200% FPL (where CSR is weak or unavailable) as well as eroding at incomes under 200% FPL. Note above that gold plan selection as well as bronze plan selection has increased at low incomes. Much of the gold selection increase is concentrated in Texas, where gold plans are far cheaper than silver. In 2025, almost 900,000 Texas enrollees with income under 200% FPL enrolled in gold plans. That’s about 6% of all enrollees with income under 200% FPL nationwide.

Low-income enrollees who select gold plans are giving up AV, often in exchange for a reduced premium (e.g., to obtain coverage from an insurer whose silver plan is priced above benchmark). The difference in AV is reflected most dramatically in the annual out of pocket maximum .By statute, out-of-pocket maximums are capped at a much lower level for CSR-enhanced silver plans available to those with income under 200% FPL than for all other plans, including gold. In 2026, the highest allowable OOP max for silver plans at incomes up to 200% FPL is $3,500, compared to $10,600 for other metal levels. For enrollees with income below 150% FPL, silver OOP maxes are usually far lower than $3,500, averaging $1,738 in 2026, according to KFF.

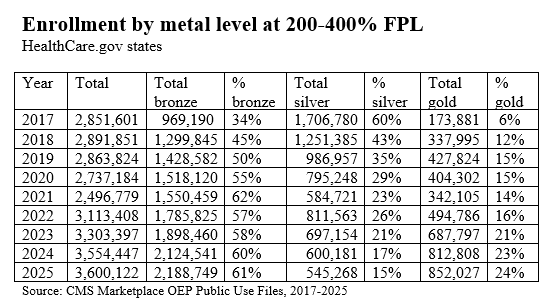
At incomes over 200% FPL, the window in which the premium difference between silver plans and bronze plans is worth the higher AV provided by silver plans is very narrow — and again, in many states, at least some gold plans are cheaper than benchmark silver. Silver selection at incomes over 200% FPL has appropriately collapsed. Here is the breakout in HealthCare.gov states:

With respect to average weighted AV, the increase in gold selection in this income bracket only partly offsets the larger increase in bronze selection. But again, inflated silver premiums more often than not make bronze a better value than silver at incomes over 200% FPL.

Why enrollment has doubled and silver plan selection has diminished

The story of why enrollment surged after ARPA was enacted in March 2021 is in one sense straightforward: ARPA made high-CSR coverage free to enrollees with income up to 150% FPL, increased premium subsidies in every income bracket, and lifted the income cap on subsidy eligibility. But the story is somewhat complicated, for better and worse, by surging broker participation in those years. The number of brokers registered with HealthCare.gov rose from 49,000 in 2018 to 83,000 as of OEP for 2024. Since Americans remain persistently ignorant about what’s available in the marketplace until they need it, increased broker outreach was probably key to the doubling of enrollment in the post-ARPA era. At the same time, broker fraud also metastasized around 2023-2024. A CMS crackdown and rule-tightening has probably reduced such fraud but has not yet quelled it, to judge from broker discussion sites I tune into. Brokers enrolled probably some hundreds of thousands of people without their knowledge or consent — the totals are still unknown — and engaged in unauthorized plan switching — sometimes multiple times — for hundreds of thousands more. (The switching may have slightly pushed average AV down slightly, as fraudster brokers looked for zero-premium plans to switch enrollees into, and most of those would be bronze plans.)

The story of why silver selection has eroded at incomes under 200% FPL is more complicated. As more low-income enrollees have poured into the marketplace in the enhanced subsidy era, some may simply make mistakes. The number of available plans in each rating area has proliferated; the average enrollee is confronted with more than 100 choices. Most enrollments are broker-assisted, and there is a fair amount of low-quality and sometimes corrupt brokerage, though I know of no source or means to assess broker quality norms (a good broker is priceless, given our ridiculously complex marketplace, and there are plenty of good ones). At the same time, I have delved more than once into the probably-increasing incidence of enrollees choosing lower-AV coverage with eyes wide open, in order to obtain coverage from a plan with a more robust provider network or a formulary that covers the enrollee’s drugs. Competition has pushed the marketplace toward narrow networks, especially at the lowest premiums at each metal level, and that has probably induced more enrollees to trade AV for network or formulary quality.

In any case, expiration of the enhanced subsidies is likely to accelerate the erosion of CSR takeup. An option to take some or all of the premium subsidy as an HSA would of course further erode AV, trading first-dollar coverage for increased exposure to high out-of-pocket costs. Total AV for the marketplace is therefore likely to erode even faster than total enrollment if subsidies remain at current levels.

— — — — —

*AV is in one sense a misleading measure, in that the average is skewed by the small percentage of enrollees in any plan who incur very high costs (capped for the enrollee by the out-of-pocket maximum, which this year can be as high as $10,600). If your plan has an AV of 60% and covers essentially no costs before, say, an $8,500 deductible, but you’re in an accident and incur $100,000 in medical costs, if the out-of-pocket maximum is $10,000, 90% of your costs are covered. For many other enrollees in such a plan, AV may be effectively zero, even if they spend thousands of dollars out of pocket. That said, AV is a uniform measure that does indicate the relative value from year to year of marketplace coverage.

**See Gaba, who posts a table combining 6 months of effectuated enrollment for 2025 available here (find “January-July effectuated enrollment tables” for 2025) with August and September estimates provided in CMS’s monthly Medicaid and CHIP enrollment snapshots.

A note on average weighted AV calculations. The marketplace Public Use Files for 2022 through 2025 break out enrollment at each CSR level for HealthCare.gov states but not for all states. As a proxy, I used the breakouts of metal level enrollment by income in the “State, Metal Level and Enrollment Status” PUF, taking silver totals as a proxy for CSR levels, subtracting the difference between total CSR enrollment (provided for all states) and total silver enrollment at incomes from 0-200% FPL proportionately from each CSR bracket.
     For 2017, I had to get a bit more creative, as metal level selection by income was broken out only for HealthCare.gov states, though the PUF does show total silver enrollment in both HealthCare.gov states and SBM states. To estimate the distribution of silver selection by income in SBM states, I used the “SBM-FPs” — nominal state marketplaces using the federal exchange — as a proxy, since all four of those states had expanded Medicaid. I then calculated an average silver AV for HealthCare.gov states (84.6%) and SBM states (80.7%) and used those averages for total silver enrollment in each of the two categories.

Edited 1/9/25 -- including correction of a typo regarding avg. monthly enrollment in 2025 (estimated at 22.3 million, not 23.3 million).

Thanks for reading xpostfactoid! Subscribe for free:


Public domain image: Wikimedia Commons


Wednesday, July 20, 2022

Average weighted actuarial value in the ACA marketplace: about 77%

Subscribe (free) to xpostfactoid

How much exposure to out-of-pocket costs are ACA marketplace enrollees subject to, compared, say, to enrollees in employer-sponsored plans?

Exposure varies widely, according to income and metal level choice. The deductible for a marketplace enrollee with household income below 150% of the Federal Poverty Level ($19,320 for a single person) who selects a silver plan is likely to be zero (the median) or under $150 (the average), with an annual out-of-pocket maximum averaging about $1,200. For a single person with an income just over 250% FPL ($32,201), that silver plan will carry an average deductible over $4,700 (though many services, including doctor visits may not be subject to it) and an out-of-pocket max likely over $8,000. For a bronze plan enrollee at any income level, the deductible will probably top $7,000, with an out-of-pocket max near the highest allowable, $8,700.

What about actuarial value -- the percentage of the average enrollee's costs the plan is designed to cover? In employer-sponsored plans, AV averages 85-86%, according to the Kaiser Family Foundation. In the ACA marketplace, according to my calculations below, the average AV obtained by 2022 enrollees in 2022 was 77.4%. Marketplace AV ranges from 94% for silver plan enrollees in the lowest income category to 60% for bronze plans (and about 57% for the 0.6% of enrollees who select catastrophic plans, for which subsidies are not available).

Monday, December 20, 2021

If BBB remains blocked and ARPA subsidies go poof, what can CMS do to mitigate the damage?

Subscribe (free) to xpostfactoid

In the wake of Manchin's weekend declaration that he won't vote for the Build Back Better bill,  I am sure I'm not alone in choosing to hope that this is not game over, that some fragments of Biden's domestic agenda will become law. Still, it's time to face the strong possibility that the major temporary subsidy boosts in the ACA marketplace enacted in the American Rescue Plan Act will expire, and that the marketplace will revert to its under-subsidized pre-ARPA state in 2023.

It's time, then, to recall the various ways the administration can boost affordability in the marketplace without legislation, leaving coverage less affordable than it is now, but more affordable than it was before March 2021, when ARPA was enacted. 

Thursday, October 21, 2021

If Democrats fail to enhance the ACA or remove the coverage gap, what can the Biden administration do?

Subscribe to xpostfactoid


As the extent to which Senators Manchin, Sinema, and other corporate Democrats will eviscerate the original outline of the Build Back Better bill sinks in, it's time to consider the once-unthinkable: what if Democrats fail to extend the enhanced ACA marketplace subsidies enacted in the American Rescue Plan Act (ARPA) in March?  And what if -- which was always uncertain -- they fail to plug the coverage gap in states that have refused to expand Medicaid?

Wednesday, January 20, 2021

ACA marketplace coverage can be as generous as the Biden administration wants it to be

Subscribe to xpostfactoid

A core Democratic party campaign promise was to "build on" the Affordable Care Act -- which at a minimum means making coverage obtained in the ACA marketplace far more affordable.  The party now has the narrowest possible majority in the Senate, along with a narrowed majority in the House, and the presidency.  To what extent will they deliver, and by what means?

As noted in the last two posts, the current mainstream Democratic proposal, as expressed in the Affordable Care Enhancement Act that passed the House last June, includes generous boosts to ACA marketplace subsidies at every income level, capping premiums for a benchmark silver plan at a maximum of 8.5% of income, no matter how high the income. Those "enhancements" may well get watered down in legislation that must pass via reconciliation with zero defections from the most conservative party members. 

Whether in place of or to complement legislation, the Biden administration can take regulatory action on multiple fronts that would have a major impact on the coverage that marketplace enrollees get for their money. Stan Dorn and Frederick Isasi of Families USA recently proposed some half-dozen regulatory measures to improve affordability, along with other steps to streamline enrollment and expand eligibility. 

Here I want to focus on one arcane-sounding proposal, described briefly in the Families USA package, that could radically (or not so radically) increase the value of coverage at each of the ACA's metal levels.  Those levels are set by "actuarial value" (AV), the percentage of the average enrollee's yearly costs that a plan is designed to cover, as determined by a formula promulgated by a division of CMS.  By statute, plans in the ACA marketplace conform (with some wiggle room) to four AV levels: bronze (60% AV), silver (70% AV), gold (80% AV) and platinum (90% AV).

Revaluing AV

The regulatory action in question, conceived by health insurance professional Gabriel McGlamery and healthcare policy researcher David Anderson, is to change the basis by which the AV of plans at the ACA metal levels is calculated by excluding enrollees with predictably high costs from the calculation. Doing so would raise effective AV at each metal level.  

Saturday, December 05, 2020

Insured Americans' MOOP exposure rises relentlessly

Subscribe to xpostfactoid 

After premium increases exceeding 20% roiled the ACA marketplace in 2017 and 2018, premiums have been essentially flat for three years. That's good news for unsubsidized enrollees, who left the market in droves in 2017-18. The flat premiums reflect a stable market, to which insurers have been returning.

Premiums are only half of the affordability equation, however. For those who require substantial medical care, out-of-pocket costs can loom even larger. And these costs have been rising relentlessly, reflecting the degree to which medical inflation continues to outpace overall inflation, particularly in private insurance.

While deductibles are the most familiar proxy for out-of-pocket costs, the ACA's statutory annual out-of-pocket maximum (MOOP) is an at least equally important measure. The MOOP represents an enrollee's total exposure in a healthcare system in which a short hospital stay will likely hit the cap. The MOOP, moreover, applies to employer-sponsored insurance as well. Every year, the Center for Medicare and Medicaid Services (CMS) resets the highest allowable MOOP.

The MOOP cap has been rising relentlessly since the inception of the ACA marketplace, from $6,300 for an individual in 2014 to a proposed $9,100 in 2022 - a 44% increase over 9 years. (MOOP for a couple or family is double the individual amount.). The yearly increase is calculated to reflect the average increase in commercial market premiums, which in turn presumably reflects the cost of care paid for by commercial plans. For comparison, median household income increased 16% from 2014 to 2020; the maximum allowable MOOP increased 29% in that span.

Thursday, October 24, 2019

Silver loading goes into reverse in 2020


Subscribe to xpostfactoid via box at top right (requires only an email address; you'll get 2-3 emails per week on average)

CMS has published ACA marketplace premiums for 2020.  The top-line news is that premiums have dropped 3-4%.  The key point for subsidized enrollees (69% of the ACA-compliant market) is that silver loading has gone into reverse -- and consequently there will be fewer discounted plans available. That's because benchmark silver plan premiums -- the second-cheapest silver plan in each market, which determines subsidy size -- have dropped more sharply (-4%)  than average premiums for the cheapest plan at each metal level (-3%).

Silver loading, recall, is the byproduct of Trump's October 2017 cutoff of direct federal reimbursement to insurers for the Cost Sharing Reduction (CSR) subsidies they are required to provide to low income marketplace enrollees who select silver plans. Faced with the cutoff at the brink of open enrollment for 2018, most state insurance departments allowed or encouraged insurers to price CSR into silver premiums only. Since premium subsidies, designed so that the enrollee pays a fixed percentage of income, are set to a silver plan benchmark (the second cheapest silver plan), inflated silver premiums create discounts for subsidized buyers in bronze and gold plans.

Wednesday, September 25, 2019

Unsubsidized? Buy bronze (probably)

Subscribe to xpostfactoid via box at top right (requires only an email address; you'll get 2-3 emails per week on average)

In a post yesterday, David Anderson clarified something I understood only vaguely: once a health plan enrollee meets her deductible, her incurred costs will reach the plan's annual out-of-pocket (OOP) maximum much more slowly in a plan with a high actuarial value (say, a plan covering 80% of costs) than in a low-AV plan (covering 60% of costs).

The ACA requires plans to cap enrollees' annual OOP costs at no more than $7,900. Most plans at all metal levels have OOP caps over $5,000, with the exception of silver plans enhanced by strong Cost Sharing Reduction CSR) subsidies available to low income enrollees.  By the standards of the U.S.'s peer countries, that's a grotesque amount of risk for an average person to assume, but that's the world we Americans have made ourselves.

Anderson plots the rate at which an enrollee's total incurred medical costs will hit the maximum allowable OOP max in  bronze, silver, and gold plans with these features:

Tuesday, June 11, 2019

Just how much does Medicaid expansion lighten the silver load?

Subscribe to xpostfactoid via box at top right (requires only an email address; you'll get 2-3 emails per week on average)

Picking up on a premise explored last week...
Actuaries Greg Fann and Daniel Cruz have pointed out that the effects of silver loading [see note at bottom*] in the ACA marketplace should intensify over time (as CBO forecast), with silver plan premiums rising relative to those of other metal levels, increasing discounts in gold and bronze. Fann and Cruz argue that regulators should help the process along by stipulating that insurers must price plans proportionate to actuarial value, with only limited adjustment for their estimates of "induced demand," the higher usage prompted by lower out-of-pocket costs.
...and on a complicating factor: silver plan AV is substantially lower in states that have expanded Medicaid, because those states have far fewer low income enrollees for whom CSR has boosted silver plan AV to 94%:
In states that have refused to expand Medicaid, silver loads are larger, because eligibility for marketplace subsidies begins at an income of 100% of the Federal Poverty Level (FPL), as opposed to 139% FPL in expansion states. More than one third of enrollees in nonexpansion states have incomes below 139%, which qualifies them the for highest level of CSR -- and close to 90% in this income range select silver plans. Hence the estimated cost of CSR, priced into silver plans, should be higher, rendering bronze and gold plans relatively cheaper.
Most recently I noted that in New Jersey in 2019, silver plan enrollees obtained an average actuarial value of 80%, compared to  87% for the 39 HealthCare.gov states taken together. Today I want to sharpen that contrast with a measure of just how much more silver load the nonexpansion states have to work with generally than the expansion states.

Sunday, June 09, 2019

The problem with silver loading in New Jersey

Subscribe to xpostfactoid via box at top right (requires only an email address; you'll get 2-3 emails per week on average)

New Jersey's ACA marketplace disappointed in 2019. Prior to open enrollment, the state passed an individual mandate to replace the zeroed-out federal mandate and also stood up a reinsurance program. Together, these measures dropped premiums 22% below where they would otherwise have  and 9% net compared to 2018. Governor Murphy also directed all state agencies to encourage enrollment outreach and devoted a small sum of state funds to partly offset massive federal cuts to advertising and enrollment assistance.  

Nonetheless enrollment dropped 7% from 2018 levels -- higher than the overall 4% drop in the 39  states using the federal exchange, HealthCare.gov, though right at the median for states on the platform that had expanded Medicaid.

Silver loading* effects were likely a key factor in a wide performance gap between expansion and nonexpansion states on HealthCare.gov in 2019. In states on the platform that have not expanded Medicaid, 2019 enrollment was 99% of the 2018 total and 95% of 2017. In expansion states, enrollment in 2019 was 93% of 2018 and 87% of 2017. Why do nonexpansion states have a silver loading advantage? As I outlined in January (with a hat tip to Dave Anderson):
In states that have refused to expand Medicaid, silver loads are larger, because eligibility for marketplace subsidies begins at an income of 100% of the Federal Poverty Level (FPL), as opposed to 139% FPL in expansion states. More than one third of enrollees in nonexpansion states have incomes below 139%, which qualifies them the for highest level of CSR [94% AV]  -- and close to 90% in this income range select silver plans. Hence the estimated cost of CSR, priced into silver plans, should be higher, rendering bronze and gold plans relatively cheaper.
In New Jersey, the silver loading gap is particularly acute; the practice has yielded essentially no discounts at all for subsidized buyers, though in 2019 it did generate discounted off-exchange silver for unsubsidized enrollees.

Friday, April 14, 2017

Cutting off CSR is a war on the near-poor

Most coverage of the Trump administration's threats to stop paying Cost Sharing Reduction (CSR) subsidies focuses on the effect of withdrawal on insurers. And rightly so: insurers can't foot the bill for those subsidies on their own without massively raising premiums. If the federal funding is withdrawn, they will exit the ACA marketplace en masse.

It's worth stepping back to notice, though, that from an enrollee point of view, the marketplace can't function without CSR -- at least, not for the 50% of current enrollees who access strong doses of it. Without CSR, the marketplace wouldn't be even marginally serviceable for prospective customers with incomes below 200% of the Federal Poverty Level -- as 55% of uninsured Americans were in 2013, before the marketplace opened.

The average employer-sponsored plan has an actuarial value (AV) of about 82% -- that is, it covers about 82% of the average enrollee's medical costs. CSR raises the AV of a silver plan to 94% for enrollees with incomes below 150% FPL, and to 87% for enrollees in the 150-200% FPL range.& Over 60% of current marketplace enrollees are below the 200% FPL threshold, and about 85% of them select silver plans and so access the benefit, which is available only with silver.

At AV 94%, CSR generally reduces the deductible of a silver plan to the $0-250 range, and at AV 87%, to the $500-1000 range. Deductibles for silver plans without CSR average over $3,500 in 2017.

The AHCA, Paul Ryan's ACA "replacement" bill, is grossly inadequate to the needs of lower income customers, not only because its premium subsidies don't adjust for income and don't adjust adequately for age, but because it also does not adjust exposure to out-of-pocket costs according to income. That's a main reason why, for someone with an income below 150% FPL, the ACA picks up between 2 and 5.5 times as much of the total cost of healthcare (premium plus out-of-pocket expense) as does the AHCA. Because subsidies are available to people higher up the income scale in the Ryan plan, the individual market would shed lower income enrollees and pick up higher income ones should the bill be enacted (it would also shed older enrollees and pick up younger ones).

Monday, April 03, 2017

Kaiser and me, on average AV

Drew Altman, president and CEO of the Kaiser Family Foundation, wrote on March 22 that under Ryan's ACA repeal plan, the average deductible in the individual market for health insurance would rise $1550 from current levels in the ACA-compliant market.

That was based on an estimate that the average actuarial value in the current market is 72%, vs. a norm of 65% that CBO calculated for Ryan's bill. Actuarial value (AV) is the percentage of the average user's yearly medical costs covered by plan. It's calculated according to a formula mandated by the ACA.

The 72% average AV figure jumped out at me, because in April 2016 I calculated the average weighted AV in the individual market as 75.5%.  Altman's piece cites an average AV in the ACA marketplace of 79%.That's exactly what I initially calculated, though I later bumped my estimate to 80%, based on likely silver plan selection by enrollees eligible for Cost Sharing Reduction at different income levels (see note at first asterisk, here).

The difference in the overall estimate appears to stem from estimates of metal level selection (bronze, silver, etc., with AV set by statute at each level) in off-marketplace enrollment, which is something of a black box. I used unsubsidized enrollees in the ACA marketplace as a proxy and calculated their average weighted AV at 68.7%.  According to an as-yet unpublished methodology note forwarded to me, Kaiser appears to have relied on 2016 data from the online broker eHealth, which included  a metal level breakout among their customers indicating an average weighted AV of 65.8%:


Sunday, March 19, 2017

AHCA vs. ACA: Total subsidized shares of costs at different income levels and ages

Late last year I cooked up a simple measure of the value of any given health insurance subsidy: the percentage of the premium paid multiplied by the actuarial value (AV) of the insurance obtained. AV is the estimated percentage of the average enrollee's medical costs paid for by the insurance.

In traditional Medicare, for example, for all but the highest-earning 5% of enrollees, the federal government pays about 85% of the combined premium for Parts A,B and D - which have a combined actuarial value a bit north of 80%. Hence the total subsided share of costs (can we call it TSS?) is about 69%.  Employers, according to the Kaiser Family Foundation, pay an average of 82% of the premium for individual insurance and 71% for family coverage. Given an average AV of 82% -- also a Kaiser estimate -- that yields a TSS of 66% for individual coverage and 58% for family.

I've previously estimated (see first link above) that the average subsidized ACA marketplace enrollee obtains a TSS of 59% -- with the federal government picking up an average of 73% of the premium for insurance with an average AV of 81%. Subsidies vary tremendously, however, ranging from 0% for the half of individual market enrollees who don't qualify for any help to over 90% for the lowest income enrollees obtaining silver plans enhanced with Cost Sharing Reduction.

Now, with the help of CBO analysis of the House repeal-and-replace bill, the American Health Care Act, it's possible to compare the federal TSS for people of varying income and ages under the ACA and the AHCA.

Sunday, January 08, 2017

The Rosetta Stone of Cost Sharing Reduction takeup in the ACA marketplace

I don't know why it's taken me so long to notice, but something I've always wanted to know about ACA enrollment has been hiding in plain sight since July.

The question is what percentage of marketplace enrollees at different income levels who are eligible for Cost Sharing Reduction (CSR) subsidies do in fact access the benefit by selecting silver plans, the only metal level at which CSR is available. This is important, because out-of-pocket expenses for lower income enrollees -- which means most enrollees -- are basically only manageable in CSR-enhanced plans.

CSR raises the actuarial value of a silver plan from a baseline of 70% to 94% for those with incomes up to 150% FPL; to 87% for those in the 150-200% FPL range, and to just 73% for those between 200% and 250% FPL.  Conversely, the percentage of income required to buy a silver plan rises with income -- disproportionately, to judge from takeup, which is higher at lower income levels.  Those who opt for a lower premium by buying bronze plans are leaving a valuable benefit on the table and letting themselves in for deductibles generally north of $6,000.

Every year since the launch of the ACA marketplace for 2014, HHS has published ever-more specific enrollment data (for HealthCare.gov states in particular). But CSR takeup at different levels has had to be extrapolated from various not-quite-complete hints, including data published by states that run their own marketplaces.

That was the case, that is, until this past July, when a CMS data brief  appeared with a CSR Rosetta Stone wrapped in the middle. And I'm going to take a little credit for that, as well as drawing conclusions.

Tuesday, October 25, 2016

The two-track individual market for health insurance

[Update/correction - This post originally included an important error: the RWJF breakout of off-marketplace metal levels referred to plans offered, not plans selected. While leaving that data in place, I've added survey data from the Commonwealth Fund regarding off-marketplace enrollees' metal level selections that also is not based on actual selection data but does also look rather similar to metal level selection among unsubsidized on-marketplace enrollees, as reported by HHS.]
---
There are basically two individual markets for health insurance in the United States: one for subsidy-eligible people earning under 201% of the Federal Poverty Level (FPL), and one for everyone else.

Subsidy-eligible marketplace shoppers with incomes up to 200% FPL are eligible for Cost Sharing Reduction (CSR) subsidies that radically reduce deductibles, copays and maximum out-of-pocket costs. CSR subsidies are available only to those who buy silver plans, as something over 80% of enrollees with incomes up to 200% FPL do.  CSR weakens sharply at 201% FPL and phases out at 251% FPL.

Some time ago I calculated that the weighted average actuarial value for plans sold on the marketplace in 2016 was just about 80%, (The actuarial value is the percentage of the average enrollee's yearly medical costs that the plan is designed to pay.)   80% AV is close to the average for employer-sponsored health plans, and it sounds good, but it masks a sharp division. For those with incomes up to 200% FPL, the average AV was 86%. For the unsubsidized, it was 69%. For those who obtained premium subsidies but had incomes over 200% FPL, it was also 69%.

While average AV was similar for the unsubsidized and the over-200% FPL-subsidized, their choices were somewhat different. About 60% of the over-200%-FPL subsidized group chose silver plans -- in part because weak CSR attaches to silver plans for those in the 200-250% FPL bracket. Among the unsubsidized, only 39% chose silver, but AV was boosted by 18.5% of this more affluent group choosing gold plans, and 3.3% choosing platinum.

This week, the Robert Wood Johnson Foundation published a study, reported by Modern Healthcare's Harris Meyer, that details plan choices offerings (and prices) in the off-marketplace ACA-compliant individual market. [Update: per note above, see Commonwealth Fund data below.] And it turns out, unsurprisingly, that the choices made by those who bought their plans off-marketplace -- by definition, unsubsidized -- look much like the choices of unsubsidized marketplace enrollees: a lot of bronze, but also a lot of gold and platinum.  Below is the breakout of metal level selections offerings off-marketplace for 2016 according to RWJF.*

Actuarial
Value
Percent of
Off-marketplace
enrollees plan offerings
90 (platinum)
  7.0**
80  (gold)
21.6
70 (silver)
33.7
60 (bronze)
33.1
57 (catastrophic)
  4.6**
69.6 (Weighed AVG)


Their choice pattern [insofar as it reflects plan offerings]  is pretty close to that of unsubsidized enrollees on HealthCare.gov:

Actuarial
Value
Percent of
unsubsidized
hc.gov enrollees
90 (platinum)
  3.3
80  (gold)
18.5
70 (silver)
39.0
60 (bronze)
33.0
57 (catastrophic)
  6.8
68.9 (Weighed AVG)

Thursday, August 04, 2016

On-exchange or off-exchange, the unsubsidized seem to make similar choices

Back in April, I set out to compare the coverage obtained by subsidized enrollees in health insurance plans in the ACA marketplace in 2016 with the coverage obtained by unsubsidized buyers. The measure compared was actuarial value (AV) -- the percentage of the average enrollee's annual medical costs paid by the insurer.

Long story short: the average weighted AV for subsidized buyers in the 38 states using HealthCare.gov was 81.4%, right in line with estimated averages for employer-sponsored insurance. For the 15% of HealthCare.gov enrollees who did not qualify for subsidies, average weighted AV was 68.9%. Averages in the state-based exchanges are probably about the same. The more comprehensive coverage obtained by subsidized enrollees stems from the fact that about two thirds of them also access secondary Cost Sharing Reduction (CSR subsidies, available only with silver plans.

I also inferred that the coverage obtained by those who bought ACA compliant plans outside the marketplace was roughly comparable to that obtained by  unsubsidized marketplace enrollees.  And I've just happened on some corroboration.

Thursday, July 21, 2016

In Covered California, deductibles get steeper and narrower

As deductibles have risen steadily in health plans sold in the ACA marketplace, plans are offering more services that are not subject to the deductible. HHS has embraced this trend and incorporated it in the standardized benefit designs launching in the 2017 (which are optional for insurers).

California, which has had mandatory standard plan designs since the launch of the marketplace in 2014, has always included benefits not subject to the deductible in those designs -- and they have expanded outside-the-deductible services periodically, as deductibles and copays have also risen steadily.

In 2014, bronze plans offered on Covered California had a $5,000 deductible, with no separate deductible for drugs. Three primary care doctor visits were not subject to the deductible, as were three urgent care, outpatient mental health or substance abuse visits. In 2016, when the medical deductible was raised to $6,000, a $500 pharmacy deductible was added, and laboratory tests were put outside the deductible.

Saturday, June 11, 2016

"Most people can find plans for under $100 per month with a deductible under $1000 per month"

I have long been irritated by an apparent mindset at HHS expressed in factoids such as this, from the final enrollment report for 2016:
Nearly 7 in 10 of the consumers who selected, or were automatically enrolled into, a plan in the HealthCare.gov states had the option of selecting a 2016 Marketplace plan with a net premium of $75 or less per month after the advance premium tax credit.
You'd think that all that mattered was premium price -- never mind if that $75 plan is bronze level with a $6,600 deductible. HHS marketing reflects this bias. Here's an email from last December:
Get covered and save: 8 out of 10 people who enrolled in a health insurance plan qualified for financial help. In fact, most people can find plans for $75 or less per month. 
I could go on about this, but as I already have, twice, let's move on. Perhaps a better if not so simple marketing point might be crafted after determining: What's the median price that marketplace enrollees pay for a silver plan? Given the low income skew of the marketplace customer base, that median plan will come with Cost Sharing Reduction that reduces the deductible to perhaps a tenth of the typical bronze plan's and raises the plan's actuarial value to 87%, compared to 60% for the bronze .

Thursday, April 21, 2016

Proposed in Minnesota, an industrial-strength public option

Minnesota progressives and elected officials in the state's Democratic Farmer-Labor party (DFL) are yearning to get back to the future with MinnesotaCare, the state's excellent public insurance program for residents of low-to-moderate income who earn too much to qualify for Medicaid.

Prior to ACA implementation, MinnesotaCare was available to Minnesotans with incomes up to 275% of the Federal Poverty Level. In 2015, the plan was converted under the ACA into a Basic Health Plan, which qualified it for federal funding but cut off eligibility at 200% FPL. Former enrollees above that income level were sent to the ACA marketplace, where both premiums  and out-of-pocket costs are considerably higher.

A task force appointed by the governor recommended in mid-January that the state seek an ACA innovation waiver to restore MinnesotaCare eligibility to 275% FPL, with funding equivalent to the cost of federal marketplace subsidies for enrollees up to that income threshold. I wrote about that plan and its implications on healthinsurance.org in January. Its impact on the private plan marketplace and larger individual market would be fairly modest -- just 37,000 enrollees in the 200-275% FPL range are forecast -- but it would provide high actuarial value coverage to the majority of those who would otherwise be eligible for subsidies in the ACA marketplace if MinnesotaCare did not exist.

Last month, a more radical proposal was introduced in legislation in the Minnesota State Senate. I have a piece up about this proposal today on healthinsurance.org. It would offer MinnesotaCare at only modestly reduced actuarial value (if reduced at all) to anyone who wanted to buy in. While costs have not yet been closely calculated, the hope is that the premium would be in silver plan range: