Note: Free xpostfactoid subscription is available on Substack alone, though I will continue to cross-post on this site. If you're not subscribed, please visit xpostfactoid on Substack and sign up.
Charles Gaba, via a trick that presents itself to the highly motivated, has got hold of the 2026 Public Use Files (PUFs) for the ACA marketplace before they’re officially announced and has parsed them 26 ways. He’s also kindly shared the trick, and so the file.
I want to continue my focus on the degradation of coverage — that is, the shift to lower metal levels, and in particular, the shift away from silver among those eligible for strong Cost Sharing Reduction (CSR), which raises the actuarial value of a silver plan from a baseline of 70% to 94% (at incomes up to 150% of the Federal Poverty level) or 87% (for those in the 150-200% FPL) range.*
For starters, here is the metal level breakdown for all states in 2025 vs. 2026.
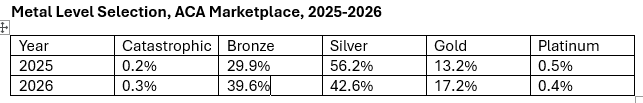
Accelerating a multi-year trend, silver selection fell sharply. a shift modestly offset by an increase in gold selection, as three states (Washington, Arkansas, Illinois) newly implemented strict silver loading in 2026, rendering gold plans less expensive than silver (in Illinois and Arkansas, 31% of enrollees selected gold plans, and in Washington, 51% selected gold).
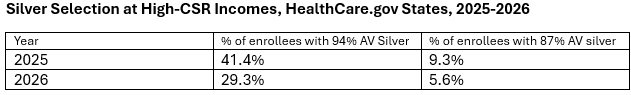
To gauge the impact of a shift from silver to bronze, we need to know the extent to which low-income enrollees abandoned silver. The PUF only provides a breakdown of CSR enrollment by CSR level (94%, 87% or 73% AV) for the states using HealthCare.gov, so for now** we’ll focus there. Since all the states except Georgia that have refused to enact the ACA Medicaid expansion use HealthCare.gov, low-income enrollees are concentrated there, as eligibility for marketplace subsidies begins at 100% FPL in nonexpansion states, as opposed to 138% FPL in expansion states.
The drop in CSR takeup in HealthCare.gov states is really bad news. Large numbers of low-income enrollees are exposing themselves to huge out-of-pocket costs.
In HealthCare.gov states, the average actuarial value obtained by enrollees dropped from 80% in 2025 to 76% in 2026. Here is the calculation:
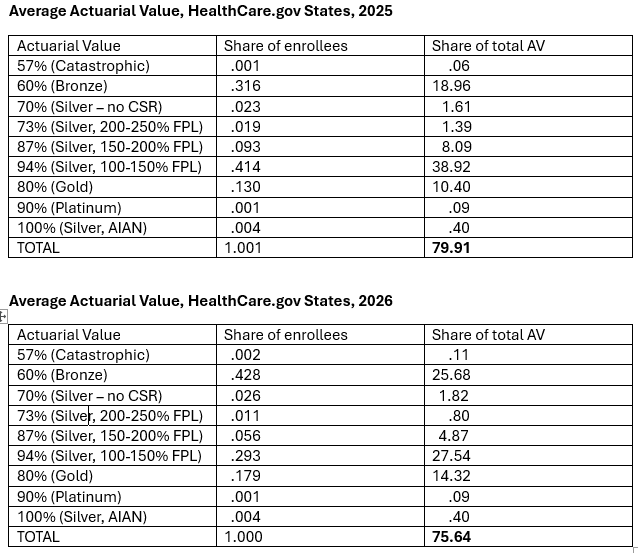
Now to test my proposed measure of total coverage degradation (or, in some future era, enhancement), Total Enrollment x Average Actuarial Value. Enrollment in 2025 (24,319,713) x AV (79.91%) comes to 19,433,883. In 2026, Enrollment (23,130,860) x AV (75.64%) comes to 17,496,183, a 10% drop. Enrollment dropped 4.9%, and average AV dropped dropped 4.3%.
As I and others have noted, moreover, average monthly enrollment in 2026 is likely to drop well below the 2025 level, as more people burdened by high premiums drop out month by month, while year-round enrollment at incomes up to 150% FPL has been terminated, and off-season enrollment via Special Enrollment Period (SEP) has been made much more difficult.
There is much more to see in metal level selection: the percentage breakout at different income levels (how high is gold enrollment at incomes over 200% FPL? Where exactly is CSR takeup at incomes under 200% FPL?), the breakout in nonexpansion states, the effects of strict silver loading on enrollment (which Gaba has already glanced at). So I expect to be back to the PUF at least once more.
— — —
* A weaker CSR raises the silver plan AV to 73% in the 200-250% FPL income range; no CSR is available at incomes over 250% FPL.
** In most years, the breakout of silver enrollment by actuarial value (70%, 73%, 87% or 94%) can be extrapolated, with only minor uncertainty, for all states, by looking at the percentage of silver enrollment at each income level in the “State, Metal Level, and Enrollment Status” PUF. I hope to do this soon, but I wanted to get the big picture out today.
No comments:
Post a Comment