Showing posts with label average monthly enrollment. Show all posts

Friday, August 11, 2023

Retention in ACA marketplace continues to improve

Note: All xpostfactoid subscriptions are now through Substack alone (still free), though I will continue to cross-post on this site. If you're not subscribed, please visit xpostfactoid on Substack and sign up! 

CMS just dropped its Effectuated Enrollment Early 2023 Snapshot and Full Year 2022 Average — a document I’ve been eagerly awaiting.

To my eye, the main takeaway is that in the second full year of enrollment after the American Rescue Plan Act (ARPA) boosted ACA marketplace subsidies, retention and off-season enrollment remain impressive. That’s reflected in average monthly enrollment for 2022 as well as early effectuated enrollment for 2023.

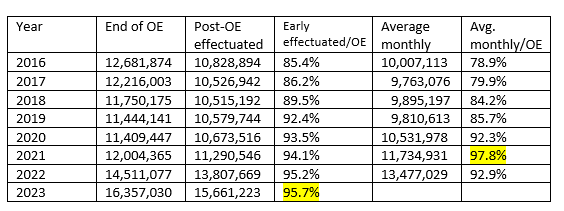
Year-over-year, from 2022 to 2023, early effectuated enrollment (enrollment as of the first month when premiums were due for all who selected plans during the Open Enrollment Period, or OEP) increased by 13.4% — more than the 12.7% year-over-year increase in plan selections during OEP, as the percentage of OEP plan selectors who effectuated enrollment reached an all-time high. That increase in retention of OEP signups continues a long-term trend.

The table below shows the ratios of early effectuated enrollment and average monthly enrollment to OEP signups since 2016.

ACA Marketplace Retention, 2016-2023 

Tuesday, October 11, 2022

Total individual market enrollment in health insurance may (finally) be at an all-time ACA-era high

Please see a 2023 update at https://xpostfactoid.substack.com/p/aca-effectuated-enrollment-in-2023 

----

In June 2021, I wondered, will attrition in the ACA marketplace go negative?

Until the pandemic struck, enrollment attrition throughout the coverage year in the ACA marketplace was an established norm. Every year, effectuated enrollment (i.e. paid-up enrollment) as of the first month after the end of Open Enrollment (OE) was between 6% and 15% lower than the "plan selection" total as of the end of OE. From February through December, enrollment would downtick by 600-800,000....

This year, we're in a different world. The Biden administration opened an emergency SEP in HealthCare.gov on February 15, extending August 15, and the state exchanges followed suit, with some variations. Then the American Rescue Plan, signed into law on March 11, provided a massive subsidy boost through 2022, with the new subsidies appearing live on HealthCare.gov on April 1, and in state exchanges pretty shortly thereafter.

Well, the results are in, courtesy of CMS's early effectuated enrollment snapshot for 2022, which includes average monthly enrollment and month-by-month enrollment totals for the year prior.* And the answer is: almost! Or, in a sense, yes!  

Average monthly enrollment in 2021 came to 97.8% of  total plan selections as of the end of the year's Open Enrollment Period -- and to 106.3% of the early effectuated enrollment total reported as of February 2021.** 

ACA marketplace enrollment retention, 2016-2022 

Year

End of OE

Post-OE effectuated

Early effectuated/OE

Average monthly

Avg. monthly/OE

2016

12,681,874

10,828,894

85.4%

10,007,113

78.9%

2017

12,216,003

10,526,942

86.2%

   9,763,076

79.9%

2018

11,750,175

10,515,192

89.5%

   9,895,197

84.2%

2019

11,444,141

10,433,850

91.2%

   9,810,613

85.7%

2020

11,409,447

10,592,901

92.8%

10,408,892

91.2%

2021

12,004,365

11,034,220

91.9%

11,734,931

97.8%

2022

14,511,077

13,807,669

95.2%


Sources: CMS state-level public use files and effectuated enrollment snapshots

Thursday, May 05, 2022

If HHS cuts back short-term plans, they'd best be sure that the ARP subsidy boosts are extended

Subscribe to xpostfactoid 

 Alice Ollstein of Politico relays:

[HHS Secretary] Becerra says he's "in the midst of rulemaking" to crack down on skimpy health insurance plans that Democratic lawmakers and activists call "junk plans." No word on when that rule could come out, but it would undo the Trump admin's rule opening the door to more of those plans.

The "skimpy health plans" are so-called short-term limited duration (STLD) plans promoted and facilitated by the Trump administration. STLD plans are not ACA-compliant: they don't have to cover the ACA-mandated Essential Health Benefits (and usually don't provide coverage of most prescription drugs), and they are medically underwritten, meaning that applicants with pre-existing conditions can be charged more, denied coverage altogether, or offered coverage with the pre-existing condition excluded.

Saturday, June 19, 2021

ACA marketplace enrollment in 2020 exceeded the 2016 peak (on-exchange)

Subscribe to xpostfactoid

Every June, the first "effectuated enrollment snapshot" of the ACA marketplace for February includes month-by-month and average monthly enrollment for the previous year.

Though I had been eagerly awaiting this year's snapshot, having inferred last December that marketplace enrollment in June 2020 was probably at all-time mid-year high, I missed its release on June 5. But it's out, and it's official: average monthly enrollment in 2020 was the highest ever, exceeding the 2016 peak by 5.2%. 

That's notwithstanding the fact that initial "plan selections" as of the end of Open Enrollment for 2016 exceeded the 2020 end-of-OE tally by almost 1.2 million (12,681,874 vs. 11,444,141). Here are the official average monthly enrollment tallies by year:

Average monthly enrollment: ACA marketplace, 2016-2020

2016     10,007,113
2017       9,763,076
2018       9,895,197
2019       9,810,613
2020     10,531,978

Although end-of-OE plan selections were 9.8% higher in 2016 than in 2020, average monthly enrollment was 5.2% higher in 2020 than in 2016 (and 7.4% higher than in 2019).  Why? 

Monday, May 17, 2021

Emergency SEP enrollment, shrinking attrition boost ACA marketplace enrollment beyond yearly top lines

Subscribe to xpostfactoid

In a report issued last September, Covered California, the golden state's ACA exchange, announced that effectuated enrollment in private health plans through the exchange had reached an all-time high of 1.53 million (1,527,730) as of June 2020.   That was in the midst of an emergency Special Enrollment Period (SEP), effectively a second open enrollment season, implemented by California in response to the Covid-19 pandemic.  (In normal years, SEPs are open only to individuals who can demonstrate a qualifying "life change," such as loss of job-based insurance.)

The emergency SEP ran from March 20 through August 31, 2020. According to the September report, SEP enrollment increased by more than 100% over the same period in 2019, to 289,460.  As the CoveredCA report stresses, that's in contrast to a mere 27% increase in SEP enrollment in the 38 states then using the federal exchange, HealthCare.gov, for which the Trump administration refused to open an emergency SEP.  In September, active membership enrolled through CoveredCA reached a new all-time high, 1,551,470.  

Driven largely by the boost in SEP enrollment, plan selections as of the end of OE 2021 in California finally surpassed their 2016 high point of 1,575,340, reaching 1,625,546. (The term "plan selections" acknowledges that not all those who "enroll" in plans during OE make a first payment and thus "effectuate" enrollment and become, in CoveredCA parlance, "active members").  

While plan selections as of the end of OE have always served as the headline number for ACA marketplace enrollment, they provide a somewhat misleading picture. Every year, an average of about 10% of those who "enroll" in plans during OE never pay their first premiums, and attrition continues throughout the year, as disenrollments exceed SEP enrollments -- at least through 2019, the last year for which monthly enrollment has been published.  But attrition has been shrinking beginning in 2018, perhaps because the silver loading that began that year sharply reduced net-of-subsidy premiums for many enrollees, including a substantial number who paid zero premium.  In 2016, national enrollment as of December was 28% below the end-of-OE total for plan selections. In 2019, December enrollment was just 20% below the end-of-OE tally.

Sunday, December 27, 2020

In response to the pandemic, ACA marketplace enrollment was likely up 6 percent-plus by June 2020, year-over-year

Subscribe to xpostfactoid 

See June 2021 update below the first chart.

CMS has released average monthly effectuated enrollment in the ACA marketplace for the first half of 2020. Combined with updated data about enrollment from February through May 2020 via the Special Enrollment Periods (SEPs) granted to people who lose access to other insurance or undergo other "life changes" outside the annual Open Enrollment period, the new data offers some measure of the extent to which Americans turned to the marketplace in response to loss of employer coverage triggered by the pandemic.

While total enrollments as of the end of Open Enrollment* were nearly identical in 2019 and 2020 (total plan selections down by 0.03%), average monthly enrollment through June (10,543,098) was up 3.4% in 2020 compared to June 2019 (10,194,206).

The average monthly enrollment comparison probably understates the impact of increased enrollment via SEP and improved retention during the pandemic months. The averages include monthly totals for January through March, when the pandemic's effects were zero to minimal. In June 2019,** effectuated enrollment was 9,797,989, 7.4% below the total for February 2019. We don't yet have a comparable figure for June 2020: it will be included in the effectuated enrollment snapshot for February 2021, which probably won't drop until this summer. But the year-over-year increase as of June 2020 was almost certainly well above the 3.4% half-year increase in average enrollment, and the increase likely continued to grow throughout 2020.

Wednesday, August 21, 2019

The retentive ACA marketplace, revisited

Subscribe to xpostfactoid via box at top right (requires only an email address; you'll get 2-3 emails per week on average)

In my last post, I noted that enrollment drops in the ACA marketplace recorded in each year of the Trump era at the end of Open Enrollment more or less evaporate in yearly comparisons of average monthly enrollment, or end-of-year enrollment.

That is, it seems that fewer people in the last two years drop out without paying, and perhaps a higher percentage remain enrolled all year (many people in the ACA marketplace do have good reasons not to remain enrolled all year -- one of the marketplace's vital roles is as a stopgap). That's congruent with another change recorded in 2019: new enrollments down (-15.7%), re-enrollments up (2.3%), as of the end of Open Enrollment.

Why have apparent enrollment drops as of the end of OE in each of the last three years either shrunk or eroded entirely over the course of the year? A few possibilities:

Friday, August 16, 2019

CMS subtext: The ACA marketplace is in recovery

Subscribe to xpostfactoid via box at top right (requires only an email address; you'll get 2-3 emails per week on average)

The CMS report on long-term enrollment trends in the ACA marketplace has a stark lede:
During two successive years of declining enrollment, from 2016 to 2018, unsubsidized enrollment declined by 2.5 million people, representing a 40 percent drop nationally. 
That's bad. But the report includes data that leads to a clear conclusion: The ACA-compliant individual market has stabilized. It is rife with problems and there are many enrollees whom it does not serve well, but it's passed through a crisis. Consider the following points (some derived from the report, others not):
  1. Subsidized enrollment was higher in 2018 than in 2016, generally understood to be the enrollment peak. In fact, total on-exchange enrollment was higher in December 2018 than in 2016. (Off-exchange enrollment, where the bulk of unsubsidized enrollment occurs, did drop sharply in those years.)

  2. Subsidized enrollment is higher in 2019 than in 2018, as of February of each year, when all enrollees have had at least one payment due (see CMS's  (2018 and 2019 Effectuated Enrollment Snapshots). 

Thursday, August 15, 2019

Is subsidized enrollment in the ACA marketplace really up since 2016?

Subscribe to xpostfactoid via box at top right (requires only an email address; you'll get 2-3 emails per week on average)

CMS's report on long-term enrollment trends in the ACA marketplace released this week emphasized the 40% drop in unsubsidized enrollment from 2016 to 2018. But the counterpoint came as something of a surprise: subsidized enrollment, according to CMS, is up since 2016.

If you look at the most often cited enrollment numbers for each year -- total plan selections reported by CMS annually at the end of the open enrollment season  -- total subsidized enrollment is down substantially -- 7.1% from 2016 to 2018, and 7.7% from 2016 to 2019. But average monthly enrollment was higher in 2018 than in 2016 -- and probably will be slightly higher this year.

It might appear that retention has improved -- more people stay in their plans for more of the year. But that's not clear, as average monthly enrollment in 2018 is not quite the same measure as in years prior.  Let's look at the numbers: