Note: Free xpostfactoid subscription is available on Substack alone, though I will continue to cross-post on this site. If you're not subscribed, please visit xpostfactoid on Substack and sign up.
 |
| CMS takes a knife to premium subsidies |
Update, 10/10: See the next post for an update as to the degree to which the CMS rule change discussed below will reduce premiums if the enhanced subsidies are not extended.
Yesterday KFF updated its estimate of the degree to which the average ACA marketplace enrollee’s premiums will rise in 2026 if the enhanced premium subsidies (created in 2021 and funded only through 2025) are allowed to expire. KFF’s widely-cited initial estimate, calculated in July 2024, was 75% for enrollees subsidized in 2025 (some of whom will lose subsidy eligibility). The new estimate for currently subsidized enrollees is 114%, with the average annual premium rising from $888 to $1,904. The increases are especially onerous for those who become newly subsidy-ineligible, as the old income cap on subsidies will snap back in place.
(Note: the enhanced subsidy schedule was created the by the American Rescue Plan Act (ARPA) in 2021 and extended through 2025 by the Inflation Reduction Act of 2022. Below, we’ll refer to the enhanced subsidies as the ARPA subsidies.)
KFF cites two reasons for the increased estimate:
Insurers’ rate requests for base premiums for this year are up an average of 18% by KFF’s calculations, which was obviously not known in July 2024. That increase directly affects unsubsidized enrollees, including the newly unsubsidized. Unsubsidized enrollees comprised just 8% of on-exchange enrollees in 2025 but will likely account for nearly 20% of (diminished) enrollment if the ARPA subsidies expire. The KFF estimate includes enrollees who are subsidized in 2025 but would not be in 2026 if the ARPA subsidies expire - i.e., many of those with income over 400% FPL ($62,600 for an individual, $84,600 for a couple).
The “applicable percentages” of income that subsidized enrollees will pay in 2026 (varying in each income bracket) are considerably higher than the percentages KFF used in its 2024 estimate. As most enrollees are subsidized, and so not directly harmed by base premium increases (and are in fact sometimes helped by increases in base premiums, as discussed below), this underestimate of the percentages of income to be paid for benchmark silver plan in each income bracket is likely the main driver of the increase in KFF’s estimate.
As I noted back in August, KFF’s underestimate of the projected increase in subsidized enrollees’ premiums in 2026 became apparent in July when the IRS published the actual subsidy schedule for 2026 (assuming the enhanced subsidies are not renewed). As I also noted, the surprisingly large difference between the KFF estimate and the actual “applicable percentages” of income to be paid by enrollees is due to some degree to a rule change enacted by Trump’s CMS, which changed the method by which an inflation adjustment in the applicable percentages is calculated. Reverting to the method the Trump administration had put in place for OEP 2020, a change the Biden administration reversed before OEP 2022, CMS included individual market premiums in its calculation of inflation in health insurance premiums since 2013. The large marketplace premium spikes of 2017 and 2018 (average benchmark premiums rose 61% from 2016-2018) still add significantly to the premium growth calculation.
My question now: how much worse did that rule change make the increase for subsidized enrollees in 2026?
The “applicable percentages” that KFF used in its 2024 estimate of enrollees’ premiums for 2024 were taken from a CBO calculation of what the subsidy schedule in 2025 would have looked like if the enhanced subsides were not in place. Every year (pre-ARPA), an adjustment to the applicable percentages was derived from a calculation of inflation in health insurance premiums divided by wage growth (the Premium Growth over Income Growth Index). When the index was below 1.0, applicable percentages would drop in the year to come; below the baseline percentages established for the first ACA plan year, 2014; when it was above 1.0, the applicable percentages would rise above the 2014 baseline. As that index (let’s call it PGIGI) is also used to calculate growth in maximum allowable out-of-pocket costs in marketplace plans, as well as the Required Contribution Percentage (don’t ask, or rather see note below), it continued to be calculated and published in the ARPA era.
In its July 2024 estimate (still widely cited until yesterday), KFF used a subsidy schedule for 2026 that CBO had derived from the PGIGI for 2025, published in a June 2024 letter to Congressional leaders who had inquired about the cost of extending the ARPA subsidies. That was I believe the lowest PGIGI ever - 0.910, and it led to the lowest applicable percentages ever.
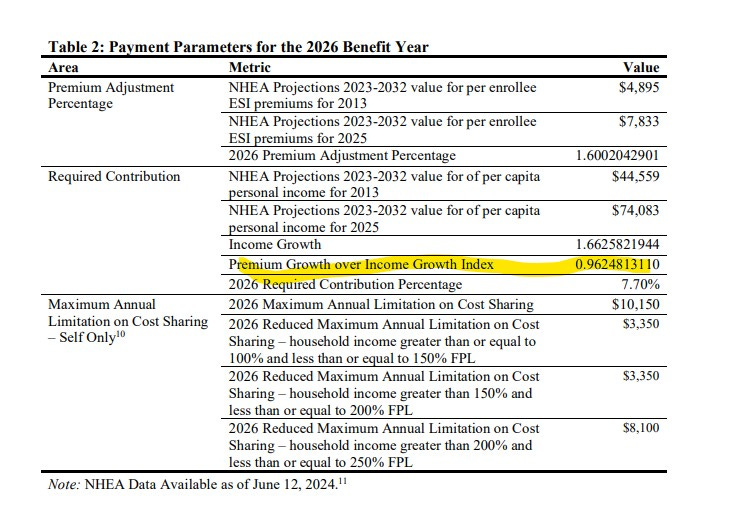
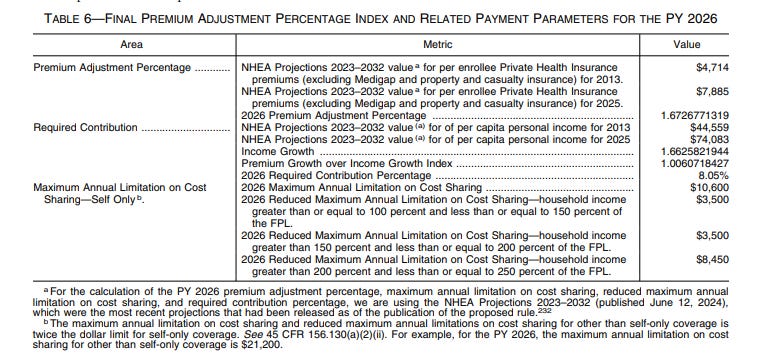
The PGIGI for 2026 published by the CMS under Biden in October 2024 was 0.962 — again, quite low. Under Trump, as noted above, CMS changed the calculation by adding individual market premium growth to the health insurance side of the equation. That boosted the PGIGI to 1.006 — 4.6% higher than under the initial calculation, and more than 10% higher than PGIGI underlying the KFF estimate (see pdf p. 97 here). The method change in the PGIGI calculation accounts for almost half of the difference between KFF’s initial calculations and actual premiums for subsidized enrollees. Update/correction, 10/10/25: the “almost half” estimate is incorrect — or rather, it’s correct for the increase in MOOP triggered by the method change (from $10,150 under the Biden administration’s initial PGIGI to $10,600 after the rule change) but incorrect as to the change in the subsidy schedule. That’s because when the IRS published the 2026 subsidy schedule in July, it accessed newly updated National Health Expenditure (NHE) spending projections, which did increase the PGIGI and applicable percentages but narrowed the gap between what the PGIGI would have been under the previous method and what was operative after the Trump administration’s rule change. The rule change boosted applicable percentages by about 17%, not 45%. Apparently the new projections increased the forecast of growth in employer-sponsored insurance more than in individual market. I will explain this in my next post.
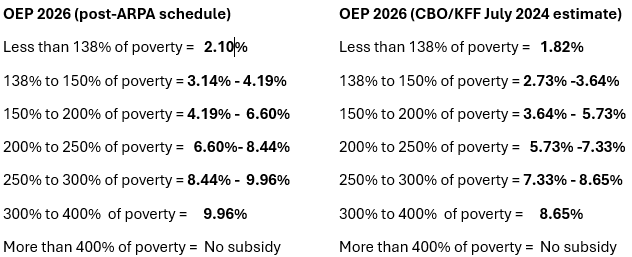
From my prior post, here is a) the difference between the subsidy schedule KFF used in its 2024 estimate and the actual subsidy schedule for 2026, and b) the resulting difference in net-of-subsidy benchmark premiums in 2026.
Percentage of income required to purchase a benchmark silver plan at different income levels in Plan Year 2026: Actual vs. KFF/CBO 2024 estimate
Monthly net-of-subsidy premium for benchmark silver plan in 2026 if ARPA subsidy enhancements expire: 2024 KFF/CBO estimate vs. actual applicable percentage
Single adult, any age. FPL for 2025 (applies to PY 2026)
The “Actual” column is now reflected in the updated KFF subsidy calculator
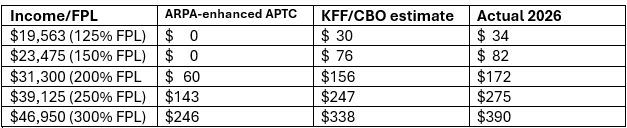
For a sense of scale as to the impact of the PGIGI method change, it raised the highest allowable annual out-of-pocket maximum from $10,150 to $10,600, an increase of 4.4%. Net-of-subsidy premiums in each income bracket are about 15% higher in actuality than in the 2024 KFF estimates and almost half [about 17% - see correction above] of that difference is attributable to CMS’s decision to incorporate the individual market in the PGIGI calculation.
For a record of how applicable percentages changed year by year, along with a detailed account of how they’re calculated, see Louise Norris.
Mitigating factors
As briefly noted above, increases in base premiums can actually be a boon to subsidized enrollees. Since subsidized enrollees pay a fixed percentage of income for the benchmark (second cheapest) silver plan, when premiums rise, subsidies rise, as do “spreads” between the benchmark and other plans. That makes plans that cost less than than the benchmark cheaper for subsidized enrollees. Those plans include a) the cheapest silver plan (usually only marginally cheaper than the benchmark), b) most bronze plans, and c) in about 15 states where strict silver loading is mandated or practiced by insurers, gold plans. In advance of OEP 2026, three states — Illinois, Arkansas and Washington — have newly mandated strict silver loading. (Very briefly: Cost Sharing Reduction (CSR), which attaches only to silver plans and is available only for enrollees with income up to 250% FPL, raises silver plans to a roughly platinum level for most silver plan enrollees. On average, then, silver plans have a higher actuarial value than gold and so “should” cost more, but usually don’t. Before October 2017, insurers were reimbursed separately for the value of CSR, but at that point Trump cut off the payments, which led to CSR being priced into premiums. Some states have used various means to mandate that gold plans be priced below silver to varying degrees.)
Another mitigating factor is inflation in the Federal Poverty Level, which rose 3.3% from $15,060 in 2024 to $15,560 in 2025 (in the marketplace, the prior-year FPL is operative). An enrollee whose income remains static gets a small subsidy boost by having a lower FPL (or potentially a large one, if the change puts her below a CSR threshold).
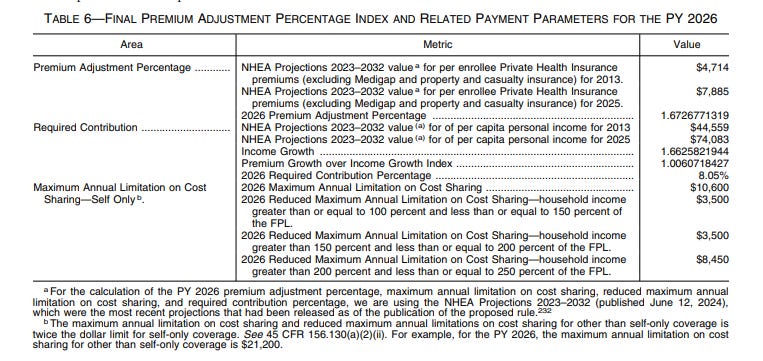
Below are the calculations showing the PGIGI for 2025 (the basis for the subsidy schedule for 2026 that KFF used in its 2024 estimate), for 2026 as set by the Biden administration, and for 2026 as finalized by Trump’s CMS.
2025 (underlying subsidy schedule used by KFF) (pg. 6)
2026 - Biden admin. (p. 6)

2026 - Trump admin. (pdf p. 97)
- - - —

* The Required Contribution Percentage is the percentage of income above which an individual is exempt from the individual mandate if the cheapest ACA-compliant plan is above that threshold. Though the Republican Congress reduced the mandate penalty to $0 in December 2017, the calculation is still made each each year because the same threshold qualifies enrollees over age 30 to purchase a catastrophic plan (which CMS recently made available to anyone who doesn’t qualify for premium subsidies).
Correction: Initially I wrote as if KFF’s cost increase estimate included all enrollees, subsidized and unsubsidized. In fact it’s based on what will happen to currently subsidized enrollees only — including those who become subsidy ineligible if the ARPA subsidies expire. I’ve adjusted language in the early paragraphs accordingly.
Update/correction, 10/10/25 (in case you missed it in the text above): the assertion that “almost half” of the PGIGI estimate is due to the method change is incorrect — or rather, it’s correct for the increase in MOOP triggered by the method change (from $10,150 under the Biden administration’s initial PGIGI to $10,600 after the rule change) but incorrect as to the change in the subsidy schedule. That’s because when the IRS published the 2026 subsidy schedule in July, it accessed newly updated National Health Expenditure (NHE) spending projections, which did increase the PGIGI and applicable percentages but narrowed the gap between what the PGIGI would have been under the previous method and what was operative after the Trump administration’s rule change. The rule change boosted applicable percentages by about 17%, not 45%. Apparently the new projections increased the forecast of growth in employer-sponsored insurance more than in individual market. I will explain this in my next post.