Attention xpostfactoid readers: All subscriptions are now through Substack alone (still free). I will continue to cross-post on this site, but I've cancelled the follow.it feed (it is an excellent free service, but Substack pulls in new subscribers). If you're not subscribed, please visit xpostfactoid on Substack and sign up!
------
My last post put a spotlight on lagging enrollment growth in the ACA’s 18 state-based marketplaces (SBMs). Enrollment in the SBMs appears on track to drop 2.8% year-over-year, from 2022 to 2023, while enrollment in the 33 states using HealthCare.gov (FFM states) looks to increase by 19.6%. While enrollment growth throughout the pandemic years has been concentrated in states that have refused to enact the ACA Medicaid expansion, enrollment in the 21 FFM states that have expanded Medicaid is up 10.3% year-over-year — perhaps the most pointed contrast with the SBM states. Longer term, while growth in the current SBEs is up 6.4% since 2020, the all-state increase during those pandemic years is 43.3%.
Let me say at the outset before diving in below that I think in my last post I may have got the emphases wrong, in that greater market penetration in SBM states in years prior to the pandemic may be a major factor. As of 2021, the uninsured rates in the SBM states were significantly lower, not only than in states that have not expanded Medicaid as you would expect, but also than in expansion FFM states. The same is true of the Kaiser Family Foundation’s estimates of the percentage of subsidy-eligible state residents who enrolled in marketplace coverage in each state in 2020. Moreover, in 2022, drops in the state unemployment rate were steeper on average in SBM states than in FFM states. That suggests a reduced pool of people needing marketplace coverage. On the other hand, UI rates remain higher on average in SBM states than in FFM states.
With the exception of Idaho, the states running their own SBMs are “blue” states that have invested considerable effort, and often state funds, in making their marketplaces as affordable and accessible as possible. They have variously implemented state-funded supplemental subsidies, individual mandates (requiring state residents to obtain insurance or pay a penalty), reinsurance programs, public option plans, standardized plans, active oversight of participating insurers, and strict silver loading (requiring insurers directly or indirectly, to price gold plans below or on par with silver) — not to mention the trouble and expense of launching and administering an exchange.
Conditions in every state are different, and the SBEs, as noted in the prior post, outperformed the HealthCare.gov states during the pre-pandemic Trump years and had proportionately smaller uninsured populations going into the pandemic. Nonetheless, the weaker enrollment growth over several years in the SBEs is worth scrutinizing. If it persists, state governments intent on improving their marketplac
One caveat before diving back into possible causes of slower enrollment growth (or negative growth this year) in the SBMs. Professional market watchers are sensibly waiting until the Open Enrollment Period ends in all states (it’s currently still running in four SBMs) and all OEP enrollments are tallied before analyzing results. I have instead taken the year-over-year change for each SBM through Week 9 of OEP and projected it to the end of OEP. There’s always the chance that some SBM states will record an enrollment surge exceeding last year’s. Even if they do, though, the change is not likely to put much of a dent in the lagging growth in current SBM states since 2020, shown in the prior post.
That said, let’s look again at some possible causes. My focus is primarily on the contrast between the SBM states (down 2.8% year-over-year in Week 9) and the FFM states that have enacted the ACA Medicaid expansion (up 10.3% in Week 10). The twelve nonexpansion states are in a growth league of their own, up 73% since 2020. Possible reasons are outlined in this post.
Drops in unemployment
Most states made significant employment gains from November 2021 to November 2022 (Open Enrollment in the ACA marketplace begins November 1). The drops (see p. 10 in this BLS release) were larger in SBM states, averaging a full percentage point, from 4.8% to 3.8%. The FFM expansion state UI rate had less far to fall, dropping from 3.8% to 3.4%. The rate in nonexpansion states dropped from 3.9% to 3.3%. A shrinking unemployed population bespeaks a shrinking pool of people needing government-subsidized health coverage. Again, though, UI rates remain higher on average in SBM states.
HealthCare.gov states playing catch-up?
Smaller uninsured populations: It’s to be expected that the uninsured rate in the SBMs, all of which have enacted the ACA Medicaid expansion, would be much lower than in the nonexpansion states. As of March 2022, 22.3 million adults enrolled in Medicaid were rendered eligible by ACA criteria(income under 138% of the Federal Poverty Level, or FPL) in 38 states and D.C. But the current SBMs also have considerably lower uninsured rates than the 21 expansion states on HealthCare.gov. As of 2021, the average uninsured rate was 6.1% in the now-current SBMs, 7.5% in FFM expansion states, and 10.9% in the twelve current nonexpansion states (South Dakota will enact the expansion this summer).
Higher marketplace takeup prior to the pandemic years? The Kaiser Family Foundation posts an estimate, last updated in 2020, of the percentage of subsidy-eligible enrollees in each state (e.g., those who qualify by income and do not have an affordable employer-sponsored or other insurance option) who are actually enrolled in marketplace plans. KFF revised its methods for this calculation circa 2017, and the results look pretty dire — though these results predate not only the pandemic but also the major increases in marketplace subsidies and subsidy eligibility enacted by the American Rescue Plan Act in March 2021. As of 2020, by KFF’s estimates, 48.9% of potentially eligible SBM state residents were enrolled, compared to 37.9% in FFM expansion states. The nonexpansion states had a 45.6% takeup rate. The nonexpansion states have a natural advantage on this front, in that they have a large pool of eligible residents with income in the 100-138% FPL range who would qualify for Medicaid in expansion states. Enrollees in this income bracket paid 0-2% of income for a benchmark silver plan with the highest level of Cost Sharing Reduction prior to ARPA’s passage; they now pay zero premium for the benchmark plan.
More potential enrollees “frozen” in Medicaid? In March 2020, the Families First Act induced states to pause Medicaid disenrollments (in exchange for a boost in federal financing) for the duration of the pandemic Public Health Emergency, which is still in effect. Medicaid and CHIP enrollment consequently increased by more than 20 million from February 2020 through September 2022, most of the increase (84% by KFF’s estimate) due to the disenrollment moratorium. The reduction in a pool of potential marketplace enrollees (though churn does swing both ways) is likely particularly pronounced in states that have enacted the ACA Medicaid expansion, which extends Medicaid eligibility to most adults with income up to 138% FPL.
But the reduction in potential marketplace enrollees who would normally have transitioned out of Medicaid appears to be larger in FFM states. While enrollment in Medicaid by those rendered eligible by the expansion (“Group VIII” in CMS parlance) increased by 36.1% from February 2020 to March 2022 in SBM states, it increased by 52.4% in FFM expansion states (excluding three states, Nebraska, Oklahoma and Missouri, that expanded between October 2020 and October 2021). As for total Medicaid enrollment in all eligibility categories, it increased 22.8% in SBM states from February 2020 to September 2022, compared to 34.3% in FFM expansion states and 30.5% in nonexpansion states. It does not appear, then, that SBM enrollment was disproportionately affected by the Medicaid moratorium. Perhaps here too, though, higher takeup in SBM states in pre-pandemic years, reflected in overall uninsured rates, is relevant.
An old ACA paradox: lower (unsubsidized) premiums means higher (subsidized) premiums
In a Twitter exchange, Monica VanBuskirk, Chief Policy and Relationships Officer at Connect for Health Colorado, the state exchange, floated another potential cause of lagging SBM growth. To compress three tweets:
I would posit it's all about the prices. States with strong provider networks (Intermountain, Kaiser, University of Colorado, etc) may have consistently higher costs, and therefore a higher SLCSP. When ARP went into effect, the geographies with high SLCSP also got the higher APTC bump. You could call it a disproportionate ARP lift.
That requires some de-acronyming. “SLCSP” is the second-lowest cost silver plan in a given market - -that is, the benchmark silver plan, which determines subsidy levels. Since enrollees pay a fixed percentage of income (rising with income) for a benchmark plan, higher benchmark premiums mean higher subsidies, and also larger spreads between the benchmark plan and cheaper plans. The American Rescue Plan, by increasing subsidies, magnified this effect, as larger subsidies will more frequently zero out the premium for plans priced below benchmark. Silver loading — the pricing of the value of Cost Sharing Reduction, available only with silver plans, into silver plan premiums (enabled by Trump’s October 2017 cutoff of direct reimbursement of insurers for CSR) — has also inflated benchmark silver premiums, and so also discounts in not-silver plans.
Benchmark premiums in the three main categories of state marketplaces — SBMs (all of which have expanded Medicaid), FFM expansion states, and nonexpansion states — do seem to align with the growth rates in those categories, to the extent that higher benchmark premiums spur enrollment. According to KFF data, in 2023, the average monthly benchmark premium for a single 40 year-old is $517 among nonexpansion states, $486 among FFM expansion states, and $456 for SBMs. Average premium spreads between the average benchmark and average lowest-cost bronze plan in each state also point to smaller discounts in the SBMs: in 2023, they average $136 in nonexpansion states, $127 in expansion FFM states, and $99 in SBMs. Benchmark-to-gold spreads tell a similar story (a smaller spread benefits enrollees unless gold premiums are lower than silver, as they are on average in about 12 states): $10 in nonexpansion states, $26 in FFM expansion states, and $37 in SBMs.
An important caveat is order for these averages of state average premiums and spreads: they are not weighted by population or enrollees. Wyoming and Florida count equally.
The “spread paradox” took on an added dimension when ARPA removed the ACA’s income cap on subsidy eligibility. Before March 2021, prospective enrollees with income above 400% FPL ($54,360 for an individual, $111,000 for a family of four in the 2023 marketplace) did not qualify for subsidies, and states were under political pressure to keep premiums down for this relatively affluent constituency. In the wake of steep premium hikes in 2017 and 2018, 15 states have implemented reinsurance programs (with partial federal funding obtained by waiver), which hold down premiums. Some of those states found that decreasing base premiums increased what the subsidized majority of enrollees paid net of subsidy. Seven states currently running SBMs have reinsurance programs in place — that is, 39% of SBMs, compared to 24% of FFM states.
That’s all I’ve got. Here’s a summary of the data discussed above.
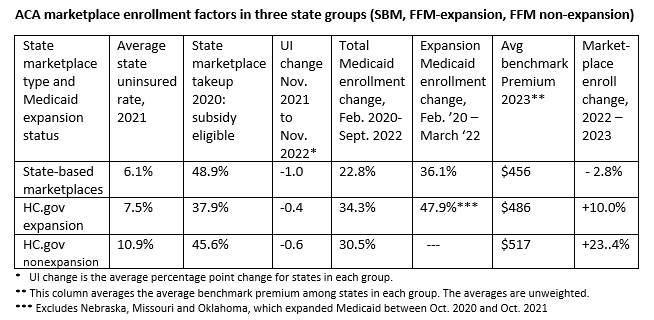
Sources: KFF for uninsured rate, total Medicaid enrollment, marketplace takeup, and avg. benchmark premiums; CMS for expansion Medicaid, BLS for UI.
See also possible causes of lagging growth in the SBMs outlined the prior post: Enhanced Direct Enrollment in FFM states; clunky SBM websites (which bears a more thorough overview); and the federally funded marketing/outreach surge in FFM states (the outcomes of which are also sure to be studied).
* * *
One story that might be gleaned from this data is that the impetus of the pandemic, boosted by emergency measures to facilitate Medicaid and marketplace enrollment, impelled FFM expansion states to close the gap between their uninsured rates and those of the SBMs, which in the pandemic years had a relatively smaller pool of uninsured to draw into Medicaid and the marketplace alike. The Biden administration’s major investment in enrollment assistance and outreach in FFM states, addressed in the prior post, may have aided this catch-up. If this story pans out, we may see uninsured rates between expansion FFM and SBM states converge in Census and NHIS reports for 2022 and 2023 — though the end of the Medicaid disenrollment moratorium in April of this year will cloud that picture.
No comments:
Post a Comment