Attention xpostfactoid readers: All subscriptions are now through Substack alone (still free). I will continue to cross-post on this site, but I've cancelled the follow.it feed (it is an excellent free service, but Substack pulls in new subscribers). If you're not subscribed, please visit xpostfactoid on Substack and sign up!
While enrollment in the ACA marketplace as a whole in the Open Enrollment Period for 2023 is on pace to finish about 13% higher than in OEP 2022, enrollment in the eighteen states that run state-based marketplaces (SBMs) is on course to come in about 3% below the OEP 2022 total.
As my last post emphasized, enrollment growth throughout the pandemic has been overwhelmingly concentrated in states that have refused to enact the ACA Medicaid expansion. In those states, about 40% of enrollees would be eligible for Medicaid if their states had enacted the expansion, and the American Rescue Plan Act made a benchmark silver plan free to almost all of them. As of this past week’s enrollment snapshot, enrollment in the twelve current nonexpansion states is up 23% year-over-year.
But enrollment in twenty-one expansion states that use the federal HealthCare.gov platform is also up by 10%. That throws the apparent enrollment decrease (barring last-minute surges or Week 9 reporting lags) in the SBMs into sharp relief and has marketplace watchers scratching their heads. (See the bottom of this post by Charles Gaba for breakouts of 2023 enrollment to date by exchange type.)
In fact, throughout the pandemic years, enrollment growth in the states currently running their own marketplaces has collectively lagged far behind growth in the overall market. Enrollment in these eighteen states is up 6% since OEP 2020, compared to 43% for the marketplace as a whole.
Six new SBEs have launched since 2020. Enrollment totals marked in red below denote that the state was using HealthCare.gov in that year.
Table 1
Enrollment in Current State-based Marketplaces, 2020-2023
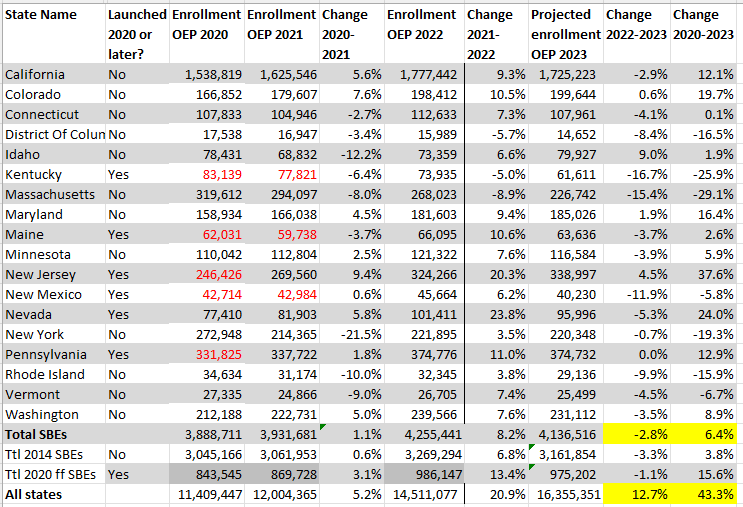
Source: CMS Marketplace Open Enrollment Public Use Files
Totals marked in red denote that the state was using HealthCare.gov in that year.
See note at bottom regarding projections of end-of-OEP 2023 totals.*
The slower growth in the SBEs in the pandemic years represents something of a reversal. From OEP 2017 to OEP 2020 — the first three years of the Trump administration, before the pandemic scrambled the calculus — enrollment in HealthCare.gov states as of the end of each OEP dropped 9%, while enrollment in the 12 SBEs then in operation ticked up by 1%.
Many attributed the declining enrollment totals in HealthCare.gov states in part to the Trump administration’s gutting of funding for enrollment assistance (reduced by 84%,) and marketing cut by 90%) in those states. The SBEs were insulated from these cuts, as enrollment assistance and outreach in the ACA marketplace is funded by a user fee assessed to insurers participating in the exchanges.
Progressives in HealthCare.gov states imprinted the lesson that states with SBMs controlled their own fate. As shown below, enrollment drops during OEPs from 2017-2020 were particularly acute in six states that have launched their own marketplaces since 2020 (labeled “Future SBEs” below).
Table 2
Enrollment in SBEs and HealthCare.gov States, 2017-2020
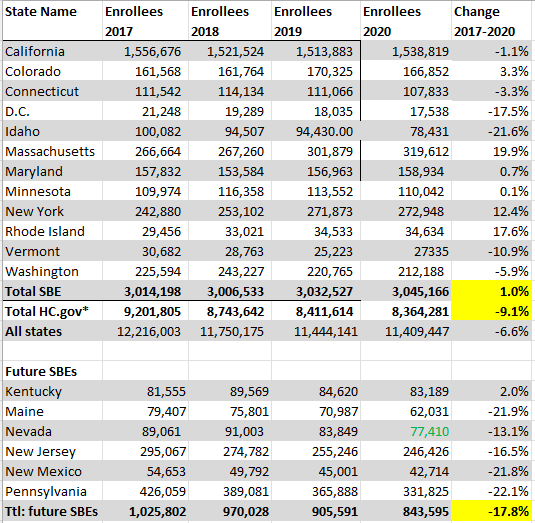
Source: CMS Marketplace Open Enrollment Public Use Files
Nevada launched its SBE in time for OEP 2020 (total marked in green)
It’s tempting to point out that the six “new” SBEs taken together essentially recouped their losses from 2017-2020 in 2021-2023. In fact, though, enrollment patterns within those six states differ radically, as they do in the 50 states generally. Myriad factors affect enrollment swings including employment, the pandemic moratorium on Medicaid disenrollments, outreach and enrollment spending, broker participation, insurer departures and new entries (which can affect premiums net of subsidy in unpredictable ways), newly added state “wraparound subsidies,” silver loading (a pricing practice that can produce steep discounts in bronze and/or gold plans), the varying quality of state websites, and state culture (though Republican-based hostility to the marketplace as such may finally be fading). Sustained enrollment drops in Massachusetts, Kentucky and Nevada bear, shall we say, local study.
All of which is to say, proceed with caution in venturing causal generalizations about enrollment patterns in broad categories of states. In fact, even the enrollment drops in HealthCare.gov states during the Trump years were something of a mirage. Retention improved during those years, to the extent that average monthly enrollment nationally was actually higher in 2020, when 11.4 million people selected plans in OEP, than in 2016, when 12.7 million did. Possible reasons: 1) the Trump administration shortened OEP and cut advertising and enrollment outreach, possibly culling more marginal enrollees; 2) large premium increases in 2017 and 2018 reduced unsubsidized enrollment, and those paying full freight may have been more likely to drop coverage; and 3) ironically, Trump’s October 2017 cutoff of direct reimbursement of insurers for the value of Cost Sharing Reduction (CSR) subsidies, which attach only to silver plans, led to “silver loading,” — the pricing of CSR directly into silver plans, which created discounts in bronze and gold plans and dramatically raised the proportion of enrollees paying nothing or next to nothing for coverage.
That said, the negative growth in thirteen out of eighteen SBEs in a year of strong enrollment growth in almost all HealthCare.gov states does ask for some explanation. A few possible factors:
The SBEs’ marketing advantage in the Trump years may have effectively been reversed as the Biden administration raises spending on enrollment assistance and outreach to new levels and rebuilt the navigator program for HealthCare.gov states.
Most if not all SBE websites present information less clearly than HealthCare.gov.
Commercial Direct Enrollment (DE) and Enhanced Direct Enrollment (EDE) platforms, widely used by brokers, can enroll people only in HealthCare.gov states. The main story here is HealthSherpa, which is faster and more user-friendly than all the government exchanges and is used by thousands of brokers. HealthSherpa processed more than 4 million applications by January 1, accounting for almost half of enrollment in HealthCare.gov states to that point. Many insurers also provide Enhanced Direct Enrollment on their websites. EDE — a program begun in the Obama administration but eagerly developed and promoted by the Trump administration — may be giving a boost to broker participation. And HealthSherpa, which enrollees can also access directly, may be smoothing enrollment for the low income enrollees in nonexpansion states who make up its core client base (43% of HealthSherpa’s enrollees are paying zero premium). (Thanks to Charles Gaba for fingering HealthSherpa as a possible factor.)
I might have thought that the SBEs had less room to grow because they’d enrolled more of the potential market in prior years. But the Kaiser Family Foundation’s estimates of the percentage of potentially subsidy-eligible people enrolled in each state as of 2020 don’t really bear that out, though more current SBE states were above the median takeup rate in that year than below it.
The pandemic’s moratorium on Medicaid disenrollments, which has been in effect since March 2020. Normally there is a lot of churn out of Medicaid, and some of those disenrolled end up in the marketplace, particularly in expansion states, which have enrolled some 20 million nondisabled adults in Medicaid via the expansion. But expansion states using HealthCare.gov did show strong enrollment growth this year.
Full employment shrinks the pool of people who need ACA marketplace coverage and are eligible for subsidies. But unemployment, low nationwide, is not particularly low in SBE states.
A few possible explanations that occurred to me don’t seem borne out by evidence:
OEP ends tomorrow in most states, though it’s open through Jan. 31 in four SBEs, (CA, DC, NJ, NY) and through Jan. 23 in Massachusetts. Final tallies, and breakouts of enrollment by income and other factors published in the spring, may provide more clues as to what’s going on in the SBEs. States have good reason to move to SBEs, which enable or facilitate state wraparound subsidies, standardized plans, public options and other potential innovations. SBEs are scheduled to come online next year in Oregon and Virginia. But the data indicates that the federal exchange may also offer significant advantages.
- - - - -
Note to Table 1: Projected final enrollment totals for each state in 2023 are derived by increasing the Week 9 total by the percentage increase in that state that occurred in 2022 from Week 9 to the end of OEP. For the projected all-state total, I added 3% to the current total, in line with the 2022 increase from Week 10 to end of OEP.
* When Trump abruptly cut off direct CSR reimbursement he boasted that he’d killed the ACA, despite longstanding forecasts ( see CMS 2015,, CBO 2017) that the resulting silver loading would actually boost enrollment, which it appears to have done. Whether Trump thought that stiffing insurers for the last three months of 2017 (silver loading began in 2018) would drive them out of the marketplace, or was completely ignorant of the likely effects of silver loading (though HHS leaders could not have been), or actually was okay with bolstering markets while assuring his followers he’d destroyed them, or never consciously sorted any of these possibilities, who knows? But the cutoff of direct CSR payments did strengthen the marketplace, as did the Trump administration’s encouragement of Enhanced Direct Enrollment development and receptivity to state “innovation waiver” proposals establishing reinsurance programs with partial federal funding. Even the effective repeal of the federal individual mandate (requiring those with access to affordable insurance to obtain it or pay a penalty) may have ultimately bolstered the marketplace by defusing a major source of hostility to it. On the other hand, the Trump administration did batter the marketplace by reducing the OEP period, gutting funding for enrollment assistance and marketing, and relentless encouragement of lightly regulated, ACA-noncompliant insurance markets.
No comments:
Post a Comment