Dear xpostfactoid readers: All subscriptions are now through Substack alone (still free). I will continue to cross-post on this site, but I've cancelled the follow.it feed (it is an excellent free service, but Substack pulls in new subscribers). If you're not subscribed, please visit xpostfactoid on Substack and sign up!
CMS dropped its next-to-last snapshot of ACA marketplace enrollment for 2023 today. Enrollment remains on pace for a 13% year-over-year increase.
Charles Gaba has year-over-year breakouts for each state as well as for HealthCare.gov states, state-based exchanges (SBEs), and states that have refused to enact the ACA Medicaid expansion (or, in the case of South Dakota, not yet enacted an expansion that will kick off this summer). Salient facts among those breakouts:
Enrollment in the 18 SBEs is down slightly (2.8%).
Enrollment in all states that have enacted the ACA Medicaid expansion is up 2.6%
Enrollment in 12 nonexpansion states is up 23.4%.
Enrollment in Texas is up 32% — probably triggered in part by a state law effectively requiring insurers to price gold plans lower than silver plans.
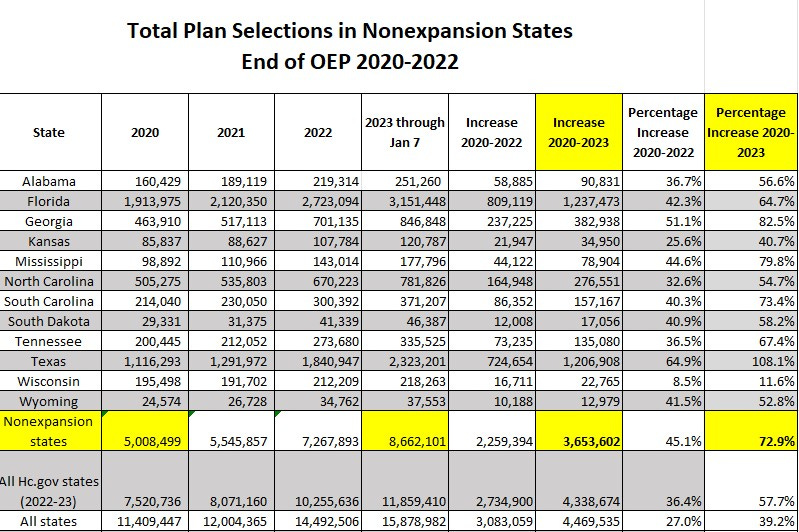
I don’t think we’ve fully fathomed the enrollment growth in nonexpansion states during the pandemic years. Since the end of the Open Enrollment Period for 2020, which ended December 15, 2019 in HealthCare.gov states (e.g., in all nonexpansion states), enrollment in the twelve states that have not enacted the expansion to date has increased by 73%. By the end of Open Enrollment on January 15, the increase will probably top 75%. Florida and Texas alone have added more than 2.4 million enrollees in those three years. The twelve states together have added 3.6 million enrollees and account for 55% of enrollment nationally.
Here are the totals. Final 2023 tallies will probably come in 3-4% higher than those recorded here.
In nonexpansion states, eligibility for ACA marketplace subsidies begins at an income of 100% of the Federal Poverty Level, as opposed to 138% FPL, the Medicaid eligibility threshold in expansion states. Since passage of the American Rescue Plan Act (ARPA) in March 2021, benchmark silver coverage with strong Cost Sharing Reduction has been free at incomes up to 150% FPL. In nonexpansion states, through 2022, about half of enrollees had income below 150% FPL (the percentage may drop a bit this year, as growth since ARPA’s passage has been higher at high incomes. Other factors that may have stimulated growth in nonexpansion states since 2020 include
Desire to be insured during the pandemic.
Supplemental unemployment insurance available from April 2020 through September 2021, which may have pushed a significant number of incomes over the 100% FPL eligibility threshold for ACA subsidies.
The emergency Special Enrollment Period implemented from Feb. 15 to Aug. 15, 2021, with the ARPA subsidies boosts rendering coverage free to many and more affordable to almost all from April 2021 on.
Restored and increased funding for enrollment assistance in HealthCare.gov states, which the Trump administration had gutted.
Year-round enrollment for applicants with incomes up to 150% FPL, available on HealthCare.gov beginning in March 2022.
In a followup post on today’s enrollment snapshot, Charles Gaba casts an interesting light on the heavy concentration of marketplace enrollment in nonexpansion states. By Gaba’s calculation, in states that have expanded Medicaid, 3.7% of the population is enrolled in marketplace coverage. In nonexpansion states, 8.3% of the population is in the marketplace.
In nonexpansion states, about 40% of marketplace enrollees — roughly 3.5 million — would be eligible Medicaid if their states had enacted the expansion. That’s about 3.5% of the population in those states, accounting for most of the difference in the percentage enrolled in marketplace coverage.
No comments:
Post a Comment