Note: All xpostfactoid subscriptions are now through Substack alone (still free), though I will continue to cross-post on this site. If you're not subscribed, please visit xpostfactoid on Substack and sign up!
 |
| Marketplace enrollment in nonexpansion states is up 135% since 2020. Drink! |
Updated 1/24/24
Politico’s Ben Leonard and Chelsea Cirruzzo, noting that ACA marketplace enrollment during the Open Enrollment Period (OEP) for 2024 was already up 25% over the final OEP 2023 tally as of December 23 (with OEP still running), locate the surge geographically:
So far, states in the South and the Rust Belt have had among the highest rates of enrollment growth between 2023 and 2024 plan years, according to a POLITICO analysis of HHS data.
Louisiana and West Virginia have the highest growth rates — about 63 percent each…Alabama, Arkansas, Georgia, Indiana, Mississippi, Ohio, South Carolina, Tennessee and Texas all had growth rates between 36 and 52 percent.
That is no surprise as to the southern states — for which, read primarily “states that have refused to enact the ACA Medicaid expansion.” While Louisiana is an expansion state, as are the three “rust belt states” cited above, the “nonexpansion” states have driven the marketplace’s surging enrollment growth throughout the pandemic years, as I’ve noted previously with respect to OEP 2021, OEP 2022, and OEP 2023. Every state marketplace is different, and enrollment in a given state may rise or fall in a given year or cluster of years for myriad reasons, but since OEP 2021, the shrinking pool of nonexpansion states (there were 14 in OEP 2021, 10 at present) have accounted for the vast majority of net new enrollments (75% of net new enrollments this year). That’s largely because of sustained growth in behemoths Florida and Texas, which together account for about a third of all marketplace enrollment.
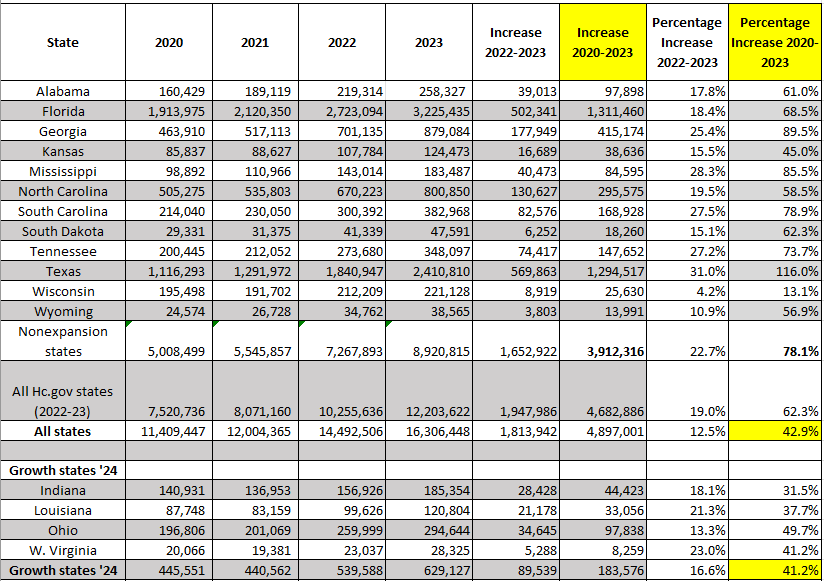
The table below shows enrollment growth from 2020-2024 in the ten states that had not expanded Medicaid as of November 1, 2023, the beginning of OEP 2024. North Carolina enacted its Medicaid expansion beginning December 1, but the migration of low-income marketplace enrollees to Medicaid does not yet show up in the enrollment tallies, so I’ve included North Carolina in the nonexpansion state group. Note also that the totals for OEP 2024 run only through December 23, 2023, while OEP ended on January 16, 2024 in the 32 states using HealthCare.gov and is still running in several state-based marketplaces. Charles Gaba estimates that the final tally for OEP 2024 will rise by another 1-2 million, or 5-11%. [Update, 1/24/24: CMS released the final enrollment snapshot for HealthCare.gov states today. National totals are near-complete, with perhaps 20,000 additional enrollees likely to be tallied in SBMs by the end of the month. I have updated the table below; for the record, the original table, with 2024 tallies through Dec. 24, is preserved at bottom.]
Total Plan Selections in Nonexpansion States, HealthCare.gov States, and All States, OEP 2020-2024

Sources: CMS Marketplace Open Enrollment Period Public Use Files; Marketplace 2024 OEP National Snapshot, Jan. 10, 2024.
Why is the enrollment surge since 2020 so concentrated in nonexpansion states? Start with the premise that the pandemic motivated a lot of people to get health insurance — and in its early months, triggered loss of employment-based insurance for millions who were laid off. Next, in nonexpansion states, eligibility for marketplace subsidies begins at 100% of the Federal Poverty Level (FPL), as opposed to 138% FPL in expansion states, where Medicaid is available to adults with income below that threshold. The generous supplemental unemployment insurance provided by the pandemic-relief CARES Act in March 2020 pushed may have pushed a lot of low-income households in nonexpansion states over the 100% FPL threshold — below which lurks the “coverage gap,” with neither Medicaid nor subsidized marketplace coverage available to most adults in those states. Rapid economic recovery, near-full employment, and rising wages probably further shrunk the population in the coverage gap.
Finally, turbo-charging the surge, in March 2021 the American Rescue Plan Act increased marketplace subsidies across the board — and rendered benchmark silver coverage with strong Cost Sharing Reduction free to enrollees with income in the 100-150% FPL range (the enhanced subsidies are funded through 2025). In 2023, nearly half of all enrollees in nonexpansion states (4.8 million out of 8.9 million) had income in the 100-150% FPL range.
As for the four expansion states flagged by Politico with 2024 enrollment increases ranging from 36-63%, I don’t see any clear pattern. The Medicaid unwinding — the resumption of Medicaid enrollment redeterminations and disenrollments after a 3-year pandemic moratorium — has boosted ACA enrollment since it began in April, but state Medicaid disenrollment rates don’t clearly correlate with expansion/nonexpansion status or marketplace enrollment rates (at least not obviously; perhaps researchers will tease out significant relationships in years to come).
It may be worth noting that enrollment from OEP 2020 to 2021 dropped in three of these four states (Louisiana, West Virginia and Indiana) and rose only modestly in the fourth (up 2.2% in Ohio). West Virginia’s marketplace is very small — the ACA cut the uninsured rate in half that very poor state entirely via the Medicaid expansion — and had long been unattractive to prospective enrollees before the ARPA subsidy boosts, as veteran navigators in the state explained to me in 2020. In Louisiana, enrollment dropped for years following a Medicaid expansion enacted in July 2016, from 214,148 in 2016 to 109,855 in 2018 and 83,159 in 2021, before jumping to 99,626 in the wake of the ARPA subsidy boosts in OEP 2022 and snapping back to 196,600 with this year’s surge.
For what it’s worth, below I’ve added the enrollment history of these four states from 2020-2023 to my previous charting of enrollment growth in nonexpansion states, HealthCare.gov states, and all states in those years. Growth since 2020 in this state group was near the national average in the 2020-2023 period.
Source: CMS Marketplace Open Enrollment Period Public Use Files.
Underscoring the state-specific nature of many enrollment surges, Charles Gaba’s tabulation as of the Jan. 10 snapshot, which makes a year-over-year comparison with same-time-last year reporting and includes updates from reports in states that run their own marketplaces, shows increases above 36% in Arizona, Kansas, Missouri, New Mexico (which boosted state-based supplemental subsidies) and Oklahoma in 2024. It’s worth noting, too, that while enrollment growth in state-based marketplaces continues to lag national averages, as it has throughout the pandemic years, growth in the SBMs taken together is a strong 14%, per Gaba. Indeed, the “growth gap” between nonexpansion states and expansion states has narrowed significantly this year. That may be due in part to the Medicaid unwinding.
Update, 1/24: Here is the original version of the first table above, posted on Jan. 17.

No comments:
Post a Comment