Note: All xpostfactoid subscriptions are now through Substack alone (still free), though I will continue to cross-post on this site. If you're not subscribed, please visit xpostfactoid on Substack and sign up!
My last post stressed that ACA enrollment growth in the Open Enrollment Period for 2024 remains heavily concentrated in states that have refused to enact the ACA Medicaid expansion.
I might have pointed out, though, that the main divide in growth rates is between the 32 HealthCare.gov states and the 19 state-based marketplaces (SBMs). The difference in year-over-year enrollment growth as of Dec. 23 between expansion and nonexpansion states within the HealthCare.gov universe is not large -- 42.1% vs. 35.6%, according to Charles Gaba. Last year, the gap was bigger: enrollment in the nonexpansion states on HealthCare.gov increased by 22.7% in OEP 2023, vs. 9.9% in expansion states on the platform (Gaba). There was a similarly wide spread in growth rates in OEP 2022.
The Medicaid “unwinding” — the resumption in April 2023 of Medicaid redeterminations and disenrollments after a three-year pandemic-induced moratorium — is a major factor in this year’s enrollment gains. As of September, CMS reported that about 1.2 million Medicaid disenrollees (about 13% of the disenrolled) had enrolled in the marketplace (or in the Basic Health Programs available to low-income enrollees in New York and Minnesota) from April through September. As Medicaid disenrollments have now passed 15 million (!), close to 2 million by now may have landed in marketplace plans or the BHPs, accounting for perhaps 40% of enrollment growth.
That boost to enrollment is apparently at work in expansion and nonexpansion states alike. Of the 16 HealthCare.gov states with growth rates above the median, eight are expansion and eight are nonexpansion states. Again, expansion states are sharing more in this year’s strong enrollment growth than in prior post-pandemic years. The Medicaid unwinding may partly explain that. While growth rates remain lower in the SBM states (all of which have expanded Medicaid) than in HealthCare.gov states, strong enrollment growth (13.8%) has resumed in the SBM group in 2024 after remaining basically flat last year.
In my last post, with respect to the Medicaid unwinding, I wrote:
…state Medicaid disenrollment rates don’t clearly correlate with expansion/nonexpansion status or marketplace enrollment rates (at least not obviously; perhaps researchers will tease out significant relationships in years to come).
Here I want to take a look at another measure of the potential impact of the Medicaid unwinding on marketplace enrollment in OEP 2024: The extent to which the migration of Medicaid disenrollees into the marketplace during the off-season boosted each given state’s marketplace enrollment. CMS has tracked those enrollments, from April through September 2023, in the Medicaid Marketplace Unwinding Report. I’ve confined my focus to the 32 states using HealthCare.gov, as state-based marketplaces are quite a various lot, both in market conditions and reporting.
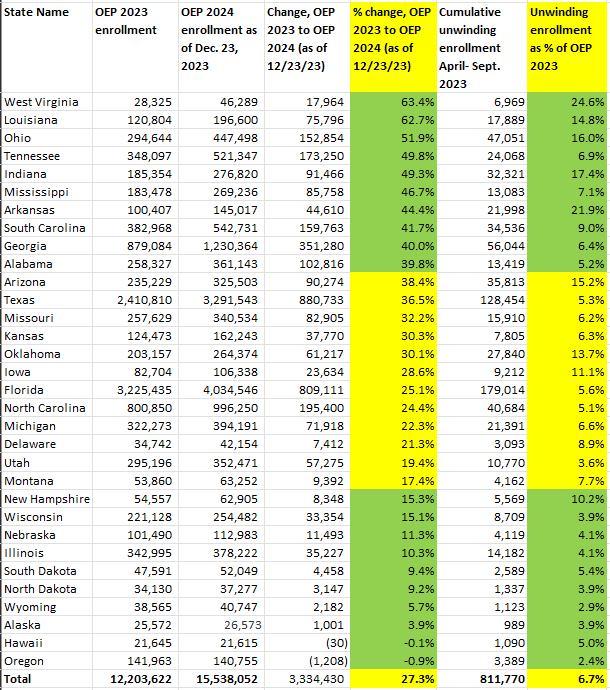
In the table below, I calculated each state’s total of “unwinding” marketplace enrollees — those disenrolled from Medicaid who enrolled in marketplace plans — as a percentage of the state’s OEP 2023 enrollment total. Then I compared those percentages with the state’s marketplace enrollment change from OEP 2023 to OEP 2024 (as of December 23, when 90-95% of end-of-OEP enrollment was likely tallied).
There does appear to be a relationship between the intensity of the off-season influx of Medicaid disenrollees into a given state marketplace and enrollment growth in that state as reflected in OEP 2024. (Perhaps by May or June, we’ll learn how many Medicaid disenrollees in each state enrolled in the marketplace throughout OEP). The ten states with the lowest enrollment growth in OEP 2024 all had below-average “unwinding” enrollment from April through September, measured as a percentage of total enrollment in OEP 2023. Nine of the ten states with the highest enrollment growth in OEP 2024 had above-average unwinding enrollment percentages.
States below are sorted by their OEP 2024 enrollment increase, highest to lowest.
Is there a relationship between unwinding enrollment and OEP enrollment growth? Perhaps.
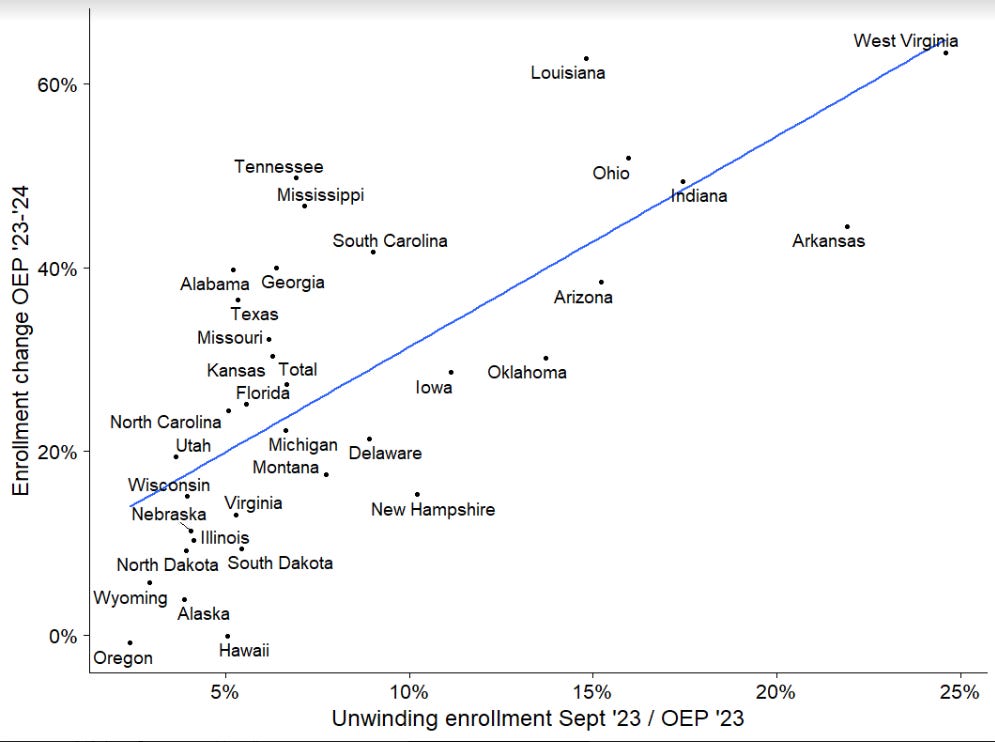
One of my sons asked ChatGPT to assess the extent of the correlation and the significance. The Chatbot came up with a Pearson correlation coefficient of 0.713, p-value 1.07×10^-6 [0.00000107]. My other son ran his own test and got substantially the same result (and improved on my charting, above). Score one for ChatGPT (and my sons).
There’s a sense in which the data reported here may be somewhat tautological. As noted above, close to 2 million Medicaid disenrollees have likely entered the marketplace since April. It’s not surprising that states that had a lot of transfers (relative to their prior marketplace enrollment population) would tend to show higher enrollment growth.
Why a given state would have more than average transfers from Medicaid to the marketplace (relative to prior marketplace enrollment) is a different question. Is it because the state disenrolled more Medicaid enrollees than average, or disenrolled them more quickly? (States’ pace of redetermination varies widely; CMS encouraged states to spread redeterminations out evenly over 12 months, but some have rushed to purge the rolls.) Is it because the state did a particularly good job referring Medicaid disenrollees to the marketplace and helping them find access to enrollment assistance?* Is it because disenrollees in the state had lower average incomes than disenrollees in other states (as is likely in nonexpansion states) and were therefore likelier to find free or very low-cost coverage in the marketplace?
In the spring, via CMS’s Marketplace Open Enrollment Period Public Use Files, we’ll get income, age, and ethnicity breakouts of marketplace enrollees. Perhaps late next summer, we’ll have complete information as to Medicaid disenrollments and Medicaid-to-marketplace transitions. It’s early to try to read the tea leaves. But what’s a blog for?
Data sources for the table above, in addition to the Medicaid Marketplace Unwinding Report and Charles Gaba posts cited above, are the Jan. 10 enrollment snapshot for OEP 2024 and CMS’s state-level marketplace public use files for prior years.
—-
* In separate data sets, CMS has reported the number of Medicaid disenrollees per state as well as the number of disenrollees who enrolled in the marketplace, cited above, both updated to September. Putting the two together, Charles Gaba has reported the percentage of Medicaid/CHIP disenrollees enrolled in QHPs (or BHPs) for each state. Those percentages do not correlate with OEP 2024 enrollment growth.
Four SBM states — California, Maryland, Massachusetts and Rhode Island — are auto-enrolling Medicaid disenrollees who qualify for marketplace subsidies into marketplace plans. While Massachusetts and Maryland show high Medicaid disenrollment-to-marketplace percentages in Gaba’s charting — above 20% — California and Rhode Island transition just 4-5%. The conversion data for the SBMs seems anomalous in various ways - -enrollment rates among those eligible for subsidies are weirdly low — which is why I confined my attention here to the FFM.
No comments:
Post a Comment