Note: All xpostfactoid subscriptions are now through Substack alone (still free), though I will continue to cross-post on this site. If you're not subscribed, please visit xpostfactoid on Substack and sign up!

The Open Enrollment Period for the ACA marketplace in 2023 was the second OEP in which the enhanced premium subsidies created by the American Rescue Plan Act (ARPA) in March 2021 were in effect. The table below shows enrollment patterns at different income levels and state groupings in what we can now call the post-ARPA era (extended through 2025 by the Inflation Reduction Act of 2022).
ARPA rendered benchmark silver coverage free at incomes up to 150% of the Federal Poverty Level; removed the previous 400% FPL income cap on subsidy eligibility, capping benchmark silver premiums at 8.5% of income above that threshold; and reduced the percentage of income required to buy a benchmark silver plan at income levels in between.
A data note before diving in: In the 18 state-based exchanges (SBEs), the data for enrollment at incomes above 400% FPL appears anomalous and probably erroneous, at least in 2022, as discussed at bottom. The far right column, which combines “income unknown” and reported incomes over 400% FPL (as well as income under 100% FPL, which was grouped with income above 400% FPL as “other” in CMS’s 2021 reporting) may give some idea of enrollment patterns at high incomes in the SBEs. Enrollment at income under 100% FPL, included by necessity, shouldn’t change much: it barely changed from 2022 to 2023, accounts for 1.4% of total enrollment and just shy of 10% of enrollment in the “<100%/>400% FPL/unknown category.”
Some takeaways from the data below:
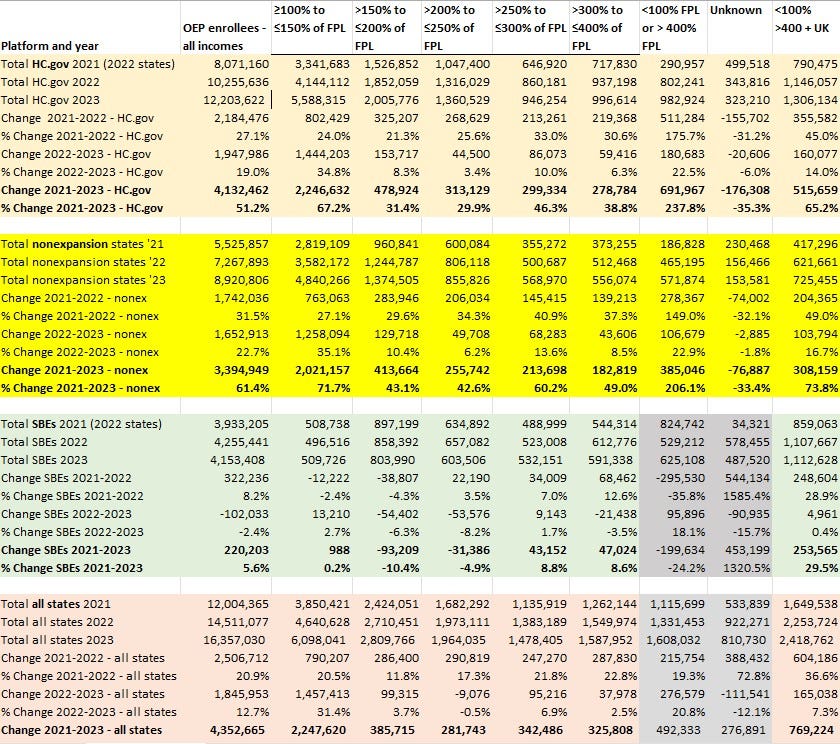
Enrollment growth is overwhelmingly concentrated in the twelve states that had not expanded Medicaid as of OEP 2023. More than three quarters (78%) of all enrollment growth from 2021-2023 occurred in those twelve states.
From OEP 2022 to OEIP 2023, enrollment growth was not only concentrated in nonexpansion states, but also, in those states, at 100-150% FPL, the income bracket eligible for free benchmark silver coverage. 76% of enrollment growth in nonexpansion states in 2023 was in this income bracket. Enrollment at 100-150% FPL in nonexpansion states accounted for 68% of all enrollment growth in all states in 2023.
Free marketplace coverage at 100-150% FPL may be serving as a very partial substitute for Medicaid coverage in nonexpansion states; that is, people with income near the 100% FPL eligibility threshold for marketplace subsidies in those states may have learned to estimate an income high enough to obtain coverage. Enrollment at incomes below 100% FPL dropped slightly in the nonexpansion states in 2023, from 114,377 to 112,021 (data not shown). That doesn’t prove anything, but it’s worth noting.
OEP for 2022 was the first enrollment season in which there was no “subsidy cliff” — that is, thanks to ARPA, no applicant who lacked access to other affordable insurance pays more than 8.5% of income for a benchmark silver plan. Enrollment growth at reported incomes above 400% FPL has accordingly tripled in the 33 states using HealthCare.gov (again, the data for 18 SBEs is unreliable at incomes over 400% FPL). Most of the growth at incomes that were previously subsidy-ineligible occurred in 2022, but in 2023 growth in the over-400% FPL bracket outstripped every other income bracket except for incomes below 150% FPL.
In OEP 2023, Enrollment growth sagged at incomes ranging from 150% FPL to 400% FPL — the broad middle — following strong growth in 2022. In fact, in OEP 2022 enrollment growth at 200-400% FPL exceeded growth at lower incomes.
As discussed at length in this post, enrollment growth has lagged in the SBEs throughout the pandemic years and in fact went negative in OEP 2023.
ACA marketplace enrollment by income & marketplace type, 2021-2023
Source: CMS State-level public use files, 2021-2023
A few notes on the calculations.
- Since three states (KY, ME, NM) formed new state-based marketplaces in advance of OEP 2022, I classified those states as SBEs for 2021 as well, to get an apples-to-apples comparison. For the same reason, since CMS lumped together incomes below 100% FPL and above 400% FPL as "other income" (i.e., mostly* subsidy-ineligible) through 2021, I have done the same here. Nationally, just 1.4% of 2023 enrollment was under 100% FPL, and the total change from 2022 to 2023 was just 8000, so the under/over category is mostly over 400% FPL, and newly subsidy-eligible.
- In 2021, Idaho's SBE did not provide income breakouts for enrollment, so CMS did not sum the income breakouts for all states (including SBEs). To fill in those blanks and make the columns summable, I applied the percentages in the Idaho income breakout for 2022 (which the state did provide) to the state's 2021 enrollment total.
- Similarly, in 2023 no totals were reported in DC for just two income categories, 400-500% FPL and > 500% FPL. I split the 800-odd enrollees in those two categories in proportions that obtained for all states, 44-56, enabling all-state totals in those income categories.
- In the state-based marketplaces, there is a very odd distribution (and shift in distribution from 2021 to 2022) between incomes over 400% FPL (subsidy-ineligible in prior years) and "other/unknown" income. It appears to me that there is some transposition in the SBEs between the over-400% FPL and "unknown" categories (Covered California, which accounts for more than 40% of SBM enrollment and publishes detailed enrollment data, shows just 4% of enrollment in the unsubsidized or “income unknown” categories in 2022 and 5% in 2023). As noted above, the far right column combines the "under/over 400% FPL" and "unknown" categories to give some sense of the change at high incomes in the SBEs.
—-
I regard this chart as a tool for contemplation. If you see anything interesting not noted above, please let me know.
Photo by Daniel Lee
No comments:
Post a Comment