Last week, I noted that in the 39 states using the HealthCare.gov platform, enrollment declines from 2018 to 2019 were generally steeper in states that had accepted the ACA Medicaid expansion than in states that have so far refused to expand.
Excluding Virginia and Maine, which are expanding Medicaid as of Jan. 1 2019, 13 of the 18 states with enrollment performance above the hc.gov median are nonexpansion states, while 15 of 18 below the median are expansion states (as is Kentucky, at the median).
My working assumption is that a measure of enrollment stability in non-expansion states is grounded in the one third-plus of enrollees in those states who have incomes that would qualify them for Medicaid in expansion states (100-138% of the Federal Poverty Level). This is the income level at which ACA marketplace offerings are most affordable and comprehensive. At 100-138% FPL, the premium for a benchmark silver plan with an actuarial value of 94% (average deductible $355) costs just 2% of income.
Apparently cutting against this hypothesis is the fact that in HealthCare.gov states in 2018, enrollment dropped 7% at 100-150% FPL while remaining essentially flat at 200-400% FPL, as at the higher income levels, silver loading discounts (see note at bottom) largely offset the effects of cuts to advertising and enrollment outreach. But the drop at 100-150% FPL was much steeper in the expansion states on the platform, where subsidy eligibility begins at 138% FPL (so that the income band is effectively 138-150% FPL). In expansion states on HealthCare.gov, enrollment in this income band cratered 14% in 2018, compared to 6% in the nonexpansion states.* At 138-150% FPL, a benchmark silver plan -- still at 94% AV -- costs 3-4% of income, compared to 2% of income for those below 138% FPL. And while silver loading reduced enrollment losses at 200-400% FPL in 2018, the resulting discounts in many cases evaporated in 2019 (though new discounts also emerged).**
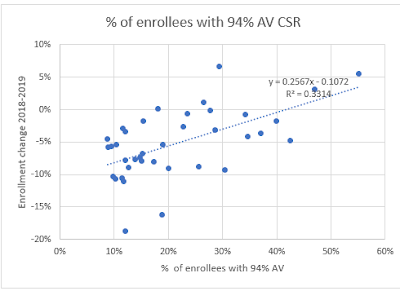
The chart below sets 2019 enrollment performance beside the percentage of enrollees in a state who obtain silver plans with the highest level of CSR, which raises the actuarial value of a silver plan to 94%. That percentage is generally much higher in nonexpansion states, where over three quarters of the enrollees in 94% AV silver would be in Medicaid if their state had accepted the expansion. The relationship is significant, I think, but can be trumped by silver loading effects, as they are in some (not all) of the highlighted states below, as well as by other factors noted below. In states marked in red, the relationship between the percentage of enrollees at 94% AV silver and enrollment performance is most sharply out of whack; in those marked in tan, more moderately so. The apparent effects (or lack thereof) of premium changes from 2018 to 2019 in highlighted states are discussed below.
The median percentage of enrollees with 94% AV silver plans in these 37 states is 19%. The median enrollment change is Kentucky's -5.38%. I have excluded Virginia and Maine, as they are in the midst of Medicaid expansion.

Sources: Charles Gaba, CMS state-level Public Use Files, 2018.
The correlation between enrollment performance and percentage of enrollees with 94% AV silver seems significant, if far from dispositive:
Of course, many other factors affect state enrollment performance. One factor that's impactful in at least some states is the high volatility of marketplace premiums from year-to-year. That volatility has probably been intensified by silver loading, the pricing in of Cost Sharing Reduction (CSR) into silver plans only, which began in 2018 after Trump cut off direct federal reimbursement of insurers for CSR. Silver loading creates discounts -- often huge ones -- in bronze and gold plans for subsidized enrollees in particular (for an explanation, see note below). These discounts depend on the spread between the premium for a benchmark silver plan and other plans in a given area. The more inflated the benchmark, the steeper the discount -- and these discounts, we learned this year, come and go. Silver loading increases premium roulette.
Roulette results are brought into sharp focus by a Kaiser Family Foundation tool that shows the premium change for the cheapest available bronze, silver and gold plans for every county (yes, every county!) in the nation. Premiums in all cases are for a single 40 year old with an income of $30,000 -- a useful point of measure, as an enrollee at this level is eligible for only weak CSR and therefore likely to be responsive to discounts in bronze and gold (and sometimes, the cheapest silver) plans.
Here's what the Kaiser tool shows in the states highlighted above, where the relationship between the percentage of 94% AV enrollees and enrollment performance seems trumped by other factors. In some cases, premium changes seem a likely major factor in enrollment performance; in others, not. Let's begin with the red-shaded states. Once again, all prices are those paid by a 40 year-old with an income of $30k.
Alaska is a Medicaid expansion state, and accordingly just 12% of enrollees have 94% AV silver, which would seem to forecast an enrollment drop steeper than the -2.89% experienced. But silver loading yielded a free bronze plan bonanza in 2018 that remains in place in 2019 -- in both years, a 40 year-old with an income of $30k pays zero premium for the cheapest bronze plan. This year, moreover, the cheapest gold plan is 39% below last year's premium, at $129 per month for the same 40 year-old -- well below the cost of benchmark silver at $30k ($207). The cheapest silver plan is up from $131 in 2018 to $161 in 2019, but that's still a significant discount below the benchmark.
Kansas, a nonexpansion state, shows a steep enrollment drop that can't be attributed to this year's premiums, which barely changed from 2018. The cheapest gold plan is steeply discounted throughout the state, with premiums for a 40 year-old earning $30k ranging from $151-$173 per month, well below the $207 premium for benchmark silver at $30k income. Cheapest bronze ranges from $35-66 per month. Cheapest silver is modestly below the benchmark in most of the state, but a sharply discounted $129/month in the state's most populous county, Johnson, and neighboring Wyandotte, which together account for a quarter of the state's population (Kansas City, KS is in Wyandotte, and Johnson County includes suburbs of Kansas City, MO).
Missouri's 9.33% enrollment drop, in contrast to Kansas's, may stem in part from lost silver loading discounts.Like Kansas, Missouri is a nonexpansion state with enrollment in 94% AV silver well above the median (30% in MO, 26% in KS). Premiums in Missouri were quite volatile, with steep drops and steep climbs in different parts of the state for the cheapest plan available at each metal level. In a cluster of counties near St. Louis accounting for 30% of the state's population, steep bronze discounts disappeared. In 2018, our 40 year-old with $30k in income could get a bronze plan for $18 per month; in 2019, cheapest bronze at this age/income is $110. Silver discounts also evaporated in this region. Similar premium hikes occurred in Jackson and surrounding counties, accounting for another 18% of the state's population. Bronze and silver premiums did improve in much of the state, however. Gold was too expensive to be much of a factor statewide.
The steep enrollment drop in Louisiana is a mystery in light of premium pricing that varied little for subsidized enrollees seeking the cheapest plan at each metal level. For a 40 year-old earning $30k, premiums for the cheapest bronze plan dropped $5/month at most and rose $13/month at most. For cheapest silver (nicely discounted in most of the state), the change range was -$6 to +$8 per month. Gold is not particularly discounted and didn't change much.
Georgia saw a good deal of price volatility. In the most populous part of the state, Fulton and surrounding counties, cheapest bronze dropped nearly by half, from $156 to $83 per month for a 40 year-old at $30k. Other parts of the state saw sharp upward swings for cheapest bronze from $26 to $145 or from $90 to $128 per month. In one large county cluster, cheapest bronze is free at 40 years/$30k. In a state with 42% of enrollees in 94% AV silver and 70% of enrollees in silver overall, however, large drops in the premium for the cheapest silver plan in much of the state may have curtailed enrollment losses.
Arizona and Arkansas, expansion states with a low percentage of enrollees in 94% AV silver, both recorded enrollment drops well below the median. In Arkansas, premiums rose steeply in the lightly populated southwest corner of the state and were up more modestly (about 5-15%) in the rest of the state for bronze and silver plans. Given across-the-board rises, a sharper enrollment drop might have been expected. Arizona is a mixed bag. In most of the state, the cheapest silver plan is newly discounted in 2019, a possible enrollment spur. Gold is also cheaper, but probably not cheap enough to spur a large shift. Bronze premiums are up modestly in most of the state.
Premiums in Wyoming barely changed, and the state offers a bonanza for subsidized enrollees. Bronze is free at $30k income throughout the state, and the cheapest gold plan is $57 per month statewide -- barely a quarter of the premium for benchmark silver. Almost half of enrollees choose gold in 2018. It's no wonder enrollment barely budged this year.
A note on Hawaii: though it's an expansion state, it has a high percentage (26%) of enrollees in 94% AV silver. That's because Pacific Islanders are ineligible for Medicaid at any income level, and like other legally present populations in that situation, they are eligible for marketplace subsidies even if their income is below 100% FPL. More about that here.
Premium swings seem to have had a significant impact on enrollment in about half the states discussed above -- maybe more, as the impact of within-state variation is hard to gauge without weighting the varying markets by population statewide, which is beyond my capability.
As I noted last week, the twelve states (including DC) that run their own exchanges outperformed HealthCare.gov states for the third year running -- a difference all the more striking in that 11 of those 12 states have expanded Medicaid. That's testament to the impact of more active oversight of the insurance market, sustained state budgets for advertising and enrollment assistance, and extended enrollment periods. As David Anderson and I noted earlier this year, the enrollment performance of California in 2018 compared to the FFE states highlights the likely impact of these efforts, and so of CMS's advertising and outreach cuts.
Other factors include the varying impact of the gutting of federal funding for enrollment assistance and outreach, insurers entering and exiting markets, premium changes for dominant insurers (which don't always offer the cheapest available plans at any metal level), and the availability of short-term plans as newly deregulated by the Trump administration.
Finally, the somewhat smaller enrollment losses in hc.gov's nonexpansion states confer a dubious "advantage," in that the enrollees in the 100-138% FPL income range would be better off in Medicaid, and the marketplace risk pools would be strengthened by their migration. The gradually shrinking "norm" for marketplace enrollment -- in the neighborhood of 10 million nationwide -- would shrink by close to two million if all states expanded Medicaid. Medicaid expansion remains the ACA's main contribution to public health in this country.
UPDATE: As noted in the next post, almost all marketplace enrollment losses this year are concentrated in the expansion states on HealthCare.gov.
--
* In expansion states on hc.gov, enrollment at 100-150% FPL dropped from 457,740 in 2017 to 392,155 in 2018. In nonexpansion states, the drop was from 2,750,502 to 2,587,081.
** Enrollment in the upper reaches of subsidy eligibility in 2018 (mainly 300-400% FPL was further boosted by huge increases (avg. 34%) in benchmark silver plan premiums, rendering more people eligible for subsidies (available in 2018 if the benchmark premium cost more than 9.56% of income). That effect reversed slightly this year, as benchmark premiums dropped an average of 1%. On the other hand, the subsidy-eligible threshold rose to 9.86% of income.
A note on silver loading
Silver loading refers to concentrating the cost of CSR subsidies (directly reimbursed to insurers by the federal government as stipulated by the ACA until Trump stopped payment in October 2017) in the premiums of silver plans, since CSR is available only with silver plans. Since premium subsidies, designed so that the enrollee pays a fixed percentage of income, are set to a silver plan benchmark (the second cheapest silver plan), inflated silver premiums create discounts for subsidized buyers in bronze and gold plans. And in states that allowed insurers to offer silver plans off-exchange with no CSR load, unsubsidized enrollees were protected from CSR costs, theoretically at least.
Excluding Virginia and Maine, which are expanding Medicaid as of Jan. 1 2019, 13 of the 18 states with enrollment performance above the hc.gov median are nonexpansion states, while 15 of 18 below the median are expansion states (as is Kentucky, at the median).
My working assumption is that a measure of enrollment stability in non-expansion states is grounded in the one third-plus of enrollees in those states who have incomes that would qualify them for Medicaid in expansion states (100-138% of the Federal Poverty Level). This is the income level at which ACA marketplace offerings are most affordable and comprehensive. At 100-138% FPL, the premium for a benchmark silver plan with an actuarial value of 94% (average deductible $355) costs just 2% of income.
Apparently cutting against this hypothesis is the fact that in HealthCare.gov states in 2018, enrollment dropped 7% at 100-150% FPL while remaining essentially flat at 200-400% FPL, as at the higher income levels, silver loading discounts (see note at bottom) largely offset the effects of cuts to advertising and enrollment outreach. But the drop at 100-150% FPL was much steeper in the expansion states on the platform, where subsidy eligibility begins at 138% FPL (so that the income band is effectively 138-150% FPL). In expansion states on HealthCare.gov, enrollment in this income band cratered 14% in 2018, compared to 6% in the nonexpansion states.* At 138-150% FPL, a benchmark silver plan -- still at 94% AV -- costs 3-4% of income, compared to 2% of income for those below 138% FPL. And while silver loading reduced enrollment losses at 200-400% FPL in 2018, the resulting discounts in many cases evaporated in 2019 (though new discounts also emerged).**
The median percentage of enrollees with 94% AV silver plans in these 37 states is 19%. The median enrollment change is Kentucky's -5.38%. I have excluded Virginia and Maine, as they are in the midst of Medicaid expansion.

Sources: Charles Gaba, CMS state-level Public Use Files, 2018.
The correlation between enrollment performance and percentage of enrollees with 94% AV silver seems significant, if far from dispositive:

Of course, many other factors affect state enrollment performance. One factor that's impactful in at least some states is the high volatility of marketplace premiums from year-to-year. That volatility has probably been intensified by silver loading, the pricing in of Cost Sharing Reduction (CSR) into silver plans only, which began in 2018 after Trump cut off direct federal reimbursement of insurers for CSR. Silver loading creates discounts -- often huge ones -- in bronze and gold plans for subsidized enrollees in particular (for an explanation, see note below). These discounts depend on the spread between the premium for a benchmark silver plan and other plans in a given area. The more inflated the benchmark, the steeper the discount -- and these discounts, we learned this year, come and go. Silver loading increases premium roulette.
Roulette results are brought into sharp focus by a Kaiser Family Foundation tool that shows the premium change for the cheapest available bronze, silver and gold plans for every county (yes, every county!) in the nation. Premiums in all cases are for a single 40 year old with an income of $30,000 -- a useful point of measure, as an enrollee at this level is eligible for only weak CSR and therefore likely to be responsive to discounts in bronze and gold (and sometimes, the cheapest silver) plans.
Here's what the Kaiser tool shows in the states highlighted above, where the relationship between the percentage of 94% AV enrollees and enrollment performance seems trumped by other factors. In some cases, premium changes seem a likely major factor in enrollment performance; in others, not. Let's begin with the red-shaded states. Once again, all prices are those paid by a 40 year-old with an income of $30k.
Alaska is a Medicaid expansion state, and accordingly just 12% of enrollees have 94% AV silver, which would seem to forecast an enrollment drop steeper than the -2.89% experienced. But silver loading yielded a free bronze plan bonanza in 2018 that remains in place in 2019 -- in both years, a 40 year-old with an income of $30k pays zero premium for the cheapest bronze plan. This year, moreover, the cheapest gold plan is 39% below last year's premium, at $129 per month for the same 40 year-old -- well below the cost of benchmark silver at $30k ($207). The cheapest silver plan is up from $131 in 2018 to $161 in 2019, but that's still a significant discount below the benchmark.
Kansas, a nonexpansion state, shows a steep enrollment drop that can't be attributed to this year's premiums, which barely changed from 2018. The cheapest gold plan is steeply discounted throughout the state, with premiums for a 40 year-old earning $30k ranging from $151-$173 per month, well below the $207 premium for benchmark silver at $30k income. Cheapest bronze ranges from $35-66 per month. Cheapest silver is modestly below the benchmark in most of the state, but a sharply discounted $129/month in the state's most populous county, Johnson, and neighboring Wyandotte, which together account for a quarter of the state's population (Kansas City, KS is in Wyandotte, and Johnson County includes suburbs of Kansas City, MO).
Missouri's 9.33% enrollment drop, in contrast to Kansas's, may stem in part from lost silver loading discounts.Like Kansas, Missouri is a nonexpansion state with enrollment in 94% AV silver well above the median (30% in MO, 26% in KS). Premiums in Missouri were quite volatile, with steep drops and steep climbs in different parts of the state for the cheapest plan available at each metal level. In a cluster of counties near St. Louis accounting for 30% of the state's population, steep bronze discounts disappeared. In 2018, our 40 year-old with $30k in income could get a bronze plan for $18 per month; in 2019, cheapest bronze at this age/income is $110. Silver discounts also evaporated in this region. Similar premium hikes occurred in Jackson and surrounding counties, accounting for another 18% of the state's population. Bronze and silver premiums did improve in much of the state, however. Gold was too expensive to be much of a factor statewide.
The steep enrollment drop in Louisiana is a mystery in light of premium pricing that varied little for subsidized enrollees seeking the cheapest plan at each metal level. For a 40 year-old earning $30k, premiums for the cheapest bronze plan dropped $5/month at most and rose $13/month at most. For cheapest silver (nicely discounted in most of the state), the change range was -$6 to +$8 per month. Gold is not particularly discounted and didn't change much.
Georgia saw a good deal of price volatility. In the most populous part of the state, Fulton and surrounding counties, cheapest bronze dropped nearly by half, from $156 to $83 per month for a 40 year-old at $30k. Other parts of the state saw sharp upward swings for cheapest bronze from $26 to $145 or from $90 to $128 per month. In one large county cluster, cheapest bronze is free at 40 years/$30k. In a state with 42% of enrollees in 94% AV silver and 70% of enrollees in silver overall, however, large drops in the premium for the cheapest silver plan in much of the state may have curtailed enrollment losses.
Arizona and Arkansas, expansion states with a low percentage of enrollees in 94% AV silver, both recorded enrollment drops well below the median. In Arkansas, premiums rose steeply in the lightly populated southwest corner of the state and were up more modestly (about 5-15%) in the rest of the state for bronze and silver plans. Given across-the-board rises, a sharper enrollment drop might have been expected. Arizona is a mixed bag. In most of the state, the cheapest silver plan is newly discounted in 2019, a possible enrollment spur. Gold is also cheaper, but probably not cheap enough to spur a large shift. Bronze premiums are up modestly in most of the state.
Premiums in Wyoming barely changed, and the state offers a bonanza for subsidized enrollees. Bronze is free at $30k income throughout the state, and the cheapest gold plan is $57 per month statewide -- barely a quarter of the premium for benchmark silver. Almost half of enrollees choose gold in 2018. It's no wonder enrollment barely budged this year.
A note on Hawaii: though it's an expansion state, it has a high percentage (26%) of enrollees in 94% AV silver. That's because Pacific Islanders are ineligible for Medicaid at any income level, and like other legally present populations in that situation, they are eligible for marketplace subsidies even if their income is below 100% FPL. More about that here.
Premium swings seem to have had a significant impact on enrollment in about half the states discussed above -- maybe more, as the impact of within-state variation is hard to gauge without weighting the varying markets by population statewide, which is beyond my capability.
As I noted last week, the twelve states (including DC) that run their own exchanges outperformed HealthCare.gov states for the third year running -- a difference all the more striking in that 11 of those 12 states have expanded Medicaid. That's testament to the impact of more active oversight of the insurance market, sustained state budgets for advertising and enrollment assistance, and extended enrollment periods. As David Anderson and I noted earlier this year, the enrollment performance of California in 2018 compared to the FFE states highlights the likely impact of these efforts, and so of CMS's advertising and outreach cuts.
Other factors include the varying impact of the gutting of federal funding for enrollment assistance and outreach, insurers entering and exiting markets, premium changes for dominant insurers (which don't always offer the cheapest available plans at any metal level), and the availability of short-term plans as newly deregulated by the Trump administration.
Finally, the somewhat smaller enrollment losses in hc.gov's nonexpansion states confer a dubious "advantage," in that the enrollees in the 100-138% FPL income range would be better off in Medicaid, and the marketplace risk pools would be strengthened by their migration. The gradually shrinking "norm" for marketplace enrollment -- in the neighborhood of 10 million nationwide -- would shrink by close to two million if all states expanded Medicaid. Medicaid expansion remains the ACA's main contribution to public health in this country.
UPDATE: As noted in the next post, almost all marketplace enrollment losses this year are concentrated in the expansion states on HealthCare.gov.
--
* In expansion states on hc.gov, enrollment at 100-150% FPL dropped from 457,740 in 2017 to 392,155 in 2018. In nonexpansion states, the drop was from 2,750,502 to 2,587,081.
** Enrollment in the upper reaches of subsidy eligibility in 2018 (mainly 300-400% FPL was further boosted by huge increases (avg. 34%) in benchmark silver plan premiums, rendering more people eligible for subsidies (available in 2018 if the benchmark premium cost more than 9.56% of income). That effect reversed slightly this year, as benchmark premiums dropped an average of 1%. On the other hand, the subsidy-eligible threshold rose to 9.86% of income.
Silver loading refers to concentrating the cost of CSR subsidies (directly reimbursed to insurers by the federal government as stipulated by the ACA until Trump stopped payment in October 2017) in the premiums of silver plans, since CSR is available only with silver plans. Since premium subsidies, designed so that the enrollee pays a fixed percentage of income, are set to a silver plan benchmark (the second cheapest silver plan), inflated silver premiums create discounts for subsidized buyers in bronze and gold plans. And in states that allowed insurers to offer silver plans off-exchange with no CSR load, unsubsidized enrollees were protected from CSR costs, theoretically at least.
No comments:
Post a Comment