Note: All xpostfactoid subscriptions are now through Substack alone (still free), though I will continue to cross-post on this site. If you're not subscribed, please visit xpostfactoid on Substack and sign up.

Brian Blase, a conservative healthcare scholar at the Paragon Institute, is out with an analysis of 2024 ACA marketplace enrollment (summarized in this WSJ op-ed) claiming that millions of enrollees have mis-estimated their incomes to claim benefits to which they are “not entitled.” Here are the core claims:
In nine states (Alabama, Florida, Georgia, Mississippi, North Carolina, South Carolina, Tennessee, Texas, and Utah), the number of sign-ups reporting income between 100 percent and 150 percent FPL exceed the number of potential enrollees. The problem is particularly acute in Florida, where we estimate there are four times as many enrollees reporting income in that range as meet legal requirements.
The problem of fraudulent exchange enrollment is much more severe in states that have not adopted the ACA’s Medicaid expansion as well as in states that use the federal exchange (HealthCare.gov). In states that use HealthCare.gov, 8.7 million sign-ups reported enrollment between 100 percent and 150 percent FPL compared to only 5.1 million people likely eligible for such coverage, or 1.7 sign-ups for every eligible person….
Unscrupulous brokers are certainly contributing to fraudulent enrollment and the enhanced direct enrollment feature of HealthCare.gov appears to be a problem. Brokers just need a person’s name, date of birth, and address to enroll them in coverage, and reports indicate that many people have been recently removed from their plan and enrolled in another plan by brokers who earn commissions by doing so.
Blase’s core conclusions — that benefits generous enough to induce the uninsured to access them should be scaled back, and that efforts to streamline enrollment should be broadly rejected — are unwarranted, as argued below. His use of the term “fraud” is overbroad. But he does point to weaknesses in enrollment security and incentives to agent malfeasance that are reflected in enrollment data and need to be addressed.
First, the ability of agents to access existing accounts or create new ones without verifiable enrollee consent, coupled with subsidy boosts enacted in March 2021 that rendered additional millions eligible for free coverage, has opened an avenue for fraud that’s been exploited in probably hundreds of thousands (not millions) of accounts in the 32 states using the federal exchange, HealthCare.gov. CMS must shut down the fraud, and quickly — working with agents, state insurance departments, insurers and commercial web-brokers — as well as implementing a tech fix (I have written about the agent/broker scandal and proposed solutions here, here, here, and here.).
Second, agents and to some extent nonprofit assisters doubtless do lead some enrollees to massage their income estimates, and, as Blase avers, they have since the marketplace’s launch in the fall prior to Plan Year 2014. That’s inevitable in a system that 1) bases benefits on future income projections, 2) mainly serves low-income people, whose income often fluctuates and is hard to predict, and 3) includes income break points where benefits change substantially — including, most radically, whether benefits are available at all, i.e., the 100% FPL minimum income requirement in states that have refused to enact the ACA Medicaid expansion. As more agents have piled into the market (there were 83,000 registered with HealthCare.gov in 2024, up from 49,000 in 2018), projected income massaging may have increased, though CMS data breaking out enrollment by income doesn’t unequivocally support that conclusion (more on that below).
Third, at least one part of one administrative rule designed to reduce enrollment friction and reduce the uninsured rate, implemented after subsidies were expanded in March 2021, has doubtless stimulated unauthorized (and fraudulent) plan-switching by agents. In early 2022, CMS introduced a continuous Special Enrollment Period (SEP) — effectively year-round enrollment — for applicants with income below 150% FPL, who, thanks to the ARPA subsidy increases, by that point had access to a benchmark silver plan for zero premium. That’s in the spirit of year-round Medicaid enrollment, as the 150% FPL threshold isn’t much higher than the 138% FPL Medicaid eligibility threshold in nonexpansion states. The problem is not with enabling the low-income uninsured to get coverage year-round, but with allowing a monthly SEP that enables monthly plan-switching. That’s what rogue brokers have exploited.
That said, Blase almost certainly exaggerates the extent of enrollment fraud and draws mostly wrong conclusions from it. CMS should be able to get a handle on unauthorized agent-executed plan-switching and enrollment. The 19 state-based marketplaces (SBMs) seem to have mostly prevented it, probably at some cost to enrollment growth, and CMS will be trying to strike a balance, adopting some requirement that an agent show proof of enrollee consent that generates less friction than do SBM security measures (e.g., requiring two-factor authorization from the client). An outbreak of preventable agent fraud should not compromise or legislatively endanger extension of the enhanced premium subsidies temporarily enacted in the American Rescue Plan, which have brought the Affordable Care Act within striking distance of living up to its name. Those enhanced subsidies were extended through 2025 by the Inflation Reduction Act but will expire if not further extended. Erasing zero-premium coverage at low incomes would mean erasing coverage gains that have been a boon to millions of low income enrollees.
It should be noted that much if not most of the impetus for agent fraud — plan-switching and enrollment not authorized by the enrollee — would disappear if ten states were not stubbornly holding out against the interests of their people, their hospitals and their finances by refusing to enact the ACA Medicaid expansion. In nonexpansion states, eligibility for marketplace subsidies begins at 100% FPL, rather than at the 138% FPL Medicaid eligibility threshold in effect in expansion states. Nonexpansion has created a huge pool of enrollees who project income in the 100-138% FPL range. People at or near poverty belong in Medicaid, which is a simpler, more affordable (with near-zero out-of-pocket costs) and more cost-effective benefit than marketplace coverage. If those states all enacted the expansion tomorrow, more than 6 million of the 9.4 million marketplace enrollees who estimated income below 150% FPL (qualifying them for free benchmark silver coverage) would transition to Medicaid — radically shrinking the marketplace in those states and changing incentives for the large call centers that have been targeting low income marketplace enrollees. But that rapid Medicaid expansion is not going to happen.
Let’s take a look at Blase’s statistical claims in more detail.
Survey data, tax data, and enrollment data
Blase’s estimates of how many subsidy-eligible people are in the 100-150% (and 100-200%) FPL income brackets are based on survey data, namely the Census Bureau’s American Community Survey, in which respondents report their insurance status and incomes. That self-reported data is always inexact and always shows results different from enrollment data. I have noted myself that enrollment growth from 2022-2024 in the 100-138% FPL bracket in nonexpansion states (a cohort that would be Medicaid-eligible in expansion states) exceeds KFF’s 2022 estimates of the uninsured in that income bracket. But KFF estimates of how many would enroll in Medicaid in a given nonexpansion state were the state to enact the expansion (as 16 states have done since 2014), also based on the ACS, consistently underestimate enrollment after the expansions happened. In fact Blase has written prior analyses complaining about allegedly ineligible expansion-group Medicaid enrollees as well (see also a rebuttal from the Center for Budget and Policy Priorities).
Seema Verma, CMS administrator during the Trump administration, was on the same page and encouraged states to step up income checks and resulting disenrollments on current enrollees. This mindset, obsessed with ensuring that someone somewhere is not getting a benefit to which they’re not entitled, generally fosters policies that deter millions from accessing benefits to which they are entitled. A 2022 MEDPAC analysis of Medicaid “churn” — disenrollment followed by re-enrollment — found that after an episode of churn, beneficiaries were more than twice as likely to be hospitalized compared to baseline rates six months prior to disenrollment, and that beneficiaries with longer gaps in coverage experienced larger percentage increases in rates of ED visits and hospitalizations. The analysis recommended eliminating mid-year data checks to detect “changes in circumstances” that could trigger disenrollment, floating continuous 12-month eligibility, which CMS mandated for children this year.
Blase cites Treasury estimates from tax data of ACA premium subsidy recipients in Plan Year 2020 broken out by income as evidence of widespread “fraud,” i.e. self-serving mis-estimates of income on the application. According to the Treasury tables, in 2019, 24% of recipients of ACA tax credits had income below 100% FPL, the eligibility threshold, while just 18% had incomes in the 100-150% FPL range, the lowest subsidy-eligible income bracket for citizens. According to the CMS marketplace public use files, only about 2%* of enrollees nationwide claim income below 100% FPL on their applications for coverage, while in PY 2020, 28% of enrollees nationwide**** put their projected income in the 100-150% FPL range.
So yes, there is a wide discrepancy between tax data and enrollment data, and the IRS data shows a large subsidized enrollment cohort whose tax returns claim income below the ACA’s 100% FPL threshold for subsidy eligibility. But that discrepancy does not necessarily indicate widespread deliberate income exaggeration by low-income enrollees. ACA subsidy data is not the only context in which income data derived from tax returns diverges widely from self-reported income data. According to the IRS tables, in 2019 26% of all U.S. families had income under 100% FPL. According to the Census Bureau’s Current Population Survey, about 10% of the population had income under 100% FPL in 2019. That’s partly due to a difference between households and individuals — in the tax data, a higher proportion of households have no children in the 100% FPL bracket than in all brackets combined. But tax data always shows a higher proportion of the population in low income brackets than the CPS and other survey data. That’s chiefly because the surveys define a household as everyone living under one roof, whereas tax data splits some of those households — and, accordingly, their income. Another key factor is that the CPS instructs respondents to include various sources of income that are excluded from the tax data. A 2012 paper from the Treasury’s Office of Tax Analysis by Ithai Lurie and James Pearce (preliminary, apparently never finished) shows that in 2007, the CPS placed 12.5% of the population below poverty, compared to 19.3% indicated by the tax data. At 100-138% FPL, the difference was 6.8% in the CPS vs. 8.1% in the tax data.
The tax data cuts two ways. On the one hand, it indicates that a quarter of ACA premium subsidy dollars go to people who would not be eligible if their income estimates matched their subsequent tax reporting. On the other hand, as Blase acknowledges in a footnote (#20*), the tax data indicates a much larger pool of potentially eligible enrollees in the 100-150% FPL than in his primary estimates— though not larger than in his estimates under “expansive assumptions.”
Blase posits that many enrollees in nonexpansion states are deliberately overestimating their income to get it over the 100% FPL threshold for subsidy eligibility, perhaps induced by brokers or nonprofit assisters, and thereby accessing benefits “to which they were not entitled.” It’s hard to know the extent to which enrollees consciously boost their estimates above 100% FPL; it’s doubtless happening to some degree (I have for years craved data as to how many enrollees estimate incomes very close to 100% FPL).
The income upon which subsidy eligibility is based is, again, an estimate — a projection of future income. For most low-income people, future income is inherently uncertain — they may be self-employed, or work uncertain hours, or work two or three (often ephemeral) jobs, or work seasonally, or depend on tips for a substantial part of their income. Many good-faith estimates are likely to miss the mark in both directions. Moreover, many people in the lowest income brackets are self-employed and may not report a substantial portion of their income — whether it’s in tips, or cash, or increments below the $600 threshold that requires payers to file a 1099. The discrepancy between income data on tax forms and on ACA applications probably says as much about how people report income on their tax forms as it does on how they report income on their ACA applications.It’s important to consider the context here. The ACA’s creators intended enrollees with income below marketplace subsidy eligibility to be eligible for Medicaid; “affordable” coverage was supposed to be available to all. The Supreme Court rendered the Medicaid expansion optional for states in 2012, and at this point 10 states have refused to enact it, despite overwhelming evidence that expansion improves population health, stimulates employment and the state economy, and provides vital income to rural and other safety net hospitals. Thanks to that ideological stubbornness, most adults who report income below 100% FPL in the nonexpansion states are “entitled” to nothing (their children are often eligible for Medicaid, even in nonexpansion states). Why should anyone accept that — and go uncovered — if they don’t have to?
It’s true, then, that enrollees with income below or near the poverty line in the ten states that have to date continued to refuse to enact the ACA Medicaid expansion have a major incentive to project an income over 100% FPL. While the ACA’s drafters intended enrollees below that threshold to be eligible for Medicaid, in the nonexpansion states (including behemoths Florida and Texas) the large majority of adults below that threshold (including all adults without children who are not aged, blind or disabled) are eligible for no help paying for coverage at all.
Some unscrupulous agents, working off leads generated by misleading ads, may be filling in incomes that guarantee access to free coverage with little or no client consultation. But responsible agents and nonprofit assisters do well to make clients aware of the 100% FPL threshold for marketplace subsidy eligibility. To the extent enrollment assisters and brokers help boost clients’ good-faith estimate of future income over the eligibility threshold, I applaud them. An income projection for the coming year is inherently uncertain, especially for the self-employed (I’m self-employed and my income fluctuates by about 20% per year, sometimes more). I worry more about the opposite problem: Ignorance of ACA offerings is rife, and many low-income people who apply for coverage and are deemed ineligible for subsidies have no idea that there’s a minimum threshold for subsidy eligibility. Applicants are often shocked when it is explained to them that they earn too little to qualify for coverage.
Medicaid to marketplace
Blase acknowledges that the low-income enrollment surge in 2024 was triggered by the Medicaid unwinding that began in spring 2023 — that is, the resumption of Medicaid eligibility “redeterminations” and disenrollments after a three-year moratorium enacted as a pandemic emergency response in March 2020. He regards a high conversion rate in HealthCare.gov of Medicaid disenrollees as evidence of fraud. But he misrepresents the percentages reported by CMS as a percentage of all Medicaid disenrollees:
70 percent of individuals enrolled in Medicaid and CHIP at the start of the unwinding process were enrolled in an exchange plan when removed from Medicaid in HealthCare.gov states.
In fact, CMS’s HealthCare.gov Marketplace Medicaid Unwinding Report tracks the percentage of Medicaid disenrollees among those who applied for marketplace coverage who did in fact end up enrolling in a marketplace plan. Blase’s tables show 6.9 million Medicaid disenrollees who had applied for marketplace coverage as of January 2024. By that point, 16.2 million people had been disenrolled from Medicaid during the unwinding, about 60%*** of them in HealthCare.gov states, or 9.6 million. Those who applied for marketplace coverage (about 42% of all unwindees) were self-selected — or recruited by brokers and nonprofit enrollment assisters. In HealthCare.gov states, 3.3 million Medicaid disenrollees had enrolled in a marketplace plan as of January — just about a third of disenrollees.
Blase cites much lower conversion rates in the SBMs — just 44% of enrollees determined eligible for premium subsidies, vs. 77% in HealthCare.gov states, and just 16% enrolled, vs. 70% — as evidence of fraud in HealthCare.gov states. But it’s not surprising that APTC eligibility would be much higher in HealthCare.gov states, given that three quarters of HealthCare.gov enrollment is in the 10 nonexpansion states, and that in those states, eligibility for subsidies begins at 100% FPL as opposed to 138% FPL in expansion states (where adults with income up to 138% FPL are Medicaid-eligible.) Conversion rates for all applicants in the SBMs are also consistently lower than in HealthCare.gov states. While security is tighter in the SBMs — brokers can’t access user accounts without proof of user consent — the very low conversion rates in the SBMs may indicate problems there with usability and functionality.
Income underestimates
Marketplace enrollment in HealthCare.gov states has always been heavily concentrated at low incomes in nonexpansion states (I first noted this in 2015). In 2021, the last year before the ARPA subsidy expansion rendered benchmark silver plans free at incomes up to 150% FPL, 41% of enrollment in HealthCare.gov states (3.4 million out of 8.2 million) was in the 100-150% FPL income range. By 2024 that percentage increased to 53% (8.7 out of 16.4 million) — a dramatic spike, but probably in line with the Medicaid unwinding.
The unwinding, in fact, accounts for most of the enrollment surge. The total number of unwindees enrolled in 2024 in HealthCare.gov states, 3.3 million, accounts for 74% of the enrollment increase from 2023 to 2024 in those states, 4.5 million. Unwindees who enroll in marketplace coverage are by definition conscious that they’ve been disenrolled from Medicaid (unlike the many unwindees who are disenrolled for “procedural” reasons and may never have received or absorbed requests for information). They are likely in many cases to have been disenrolled because increased income disqualifies them, in which case they may well be in the 100-150% FPL range (the income thresholds for parents in nonexpansion states are very low, ranging from 16% to 82% FPL). The spike from 41% of HealthCare.gov enrollment in the 100-150% FPL bracket 2021 to 53% in 2024 is not on its face implausible.
While the unwinding accounts for most of the low-income people coming into the marketplace, administrative and enrollee inertia to some extent hinder outflow. Just under a third of 2024 enrollments are auto re-enrollments, in which enrollees made no updates or changes to their accounts. Income of course fluctuates, especially at low incomes. In the states that have expanded Medicaid, a million enrollees — one tenth of the total in those states — have reported incomes in the 100-138% FPL range, which should have qualified most of them for Medicaid. (Legally present noncitizens subject to the 5-year bar for Medicaid eligibility are eligible for marketplace subsidies at any income level. The small number of enrollments at incomes below 100% FPL suggests, however, that subsidy-eligible noncitizens are probably not a majority of those in this income group.) After a Medicaid expansion, it generally takes more than a year for marketplace enrollees who are newly Medicaid-eligible to transition; North Carolina, for example, which launched its expansion in December 2023, had 338,000 marketplace enrollees in the 100-138% FPL range as of the end of the Open Enrollment Period.
Blase also contends that people with incomes in the 200-400% FPL range are in large numbers underestimating their incomes to get the free silver coverage available at incomes up to 150% FPL and/or the strong Cost Sharing Reduction available with silver plans at incomes up to 200% FPL (CSR is even stronger at income up to 150% FPL). While those who underestimate their income do have to pay back excess advanced premium tax credits at tax time, the pay-backs at income up to 400% FPL are capped and so in many cases don’t represent the full amount of excess tax credits advanced. Further, the value of Cost Sharing Reduction (CSR), which at incomes up to 200% FPL reduces the highest allowed annual out-of-pocket maximum in 2024 to $3,150, compared to $9,450 for plans without CSR (and $7,550 for the weak CSR available at 200-250% FPL), is not clawed back at tax time if it turns out that income exceeded the eligibility threshold of CSR obtained. So there are incentives to underestimate income. Blase’s example:
…for a 40-year-old enrollee at 290 percent FPL, the incentive for estimating income at just under 150 percent FPL is $1,438 on average in the United States. He would receive an APTC of $5,723 to cover the full premium of insurance coverage with an actuarial value of 94 percent. At 290 percent FPL, he was eligible for a PTC of $3,355—receiving $2,368 of excessive subsidy for much less generous coverage (70 percent actuarial value). He would need to repay $950, which would leave him better off by $1,418 in premium subsidies due to underestimating his income and the added benefit of having coverage with much less cost-sharing.
While some enrollees doubtless do lowball income estimates, a near-50% underestimate is an extreme example. The exchanges do check estimated income against their “trusted data sources” and will require documentation if the estimate is out of whack. While HealthCare.gov will not withhold subsidies for an income overestimate if it appears that actual income is below 100% FPL*****, the exchange will reduce APTC and in some cases force a switch out of a high-CSR plan if a challenged enrollee credibly support what looks like an underestimate. People at higher incomes are likelier to have a fixed, steady paycheck that would not support an underestimate — though to be sure, many people in the 200-400% FPL range may have fluctuating incomes. A broker in Texas tells me, however, that post-pandemic, and during the Biden era generally, mid-year rejection of income estimates that appear underestimated have become rare.
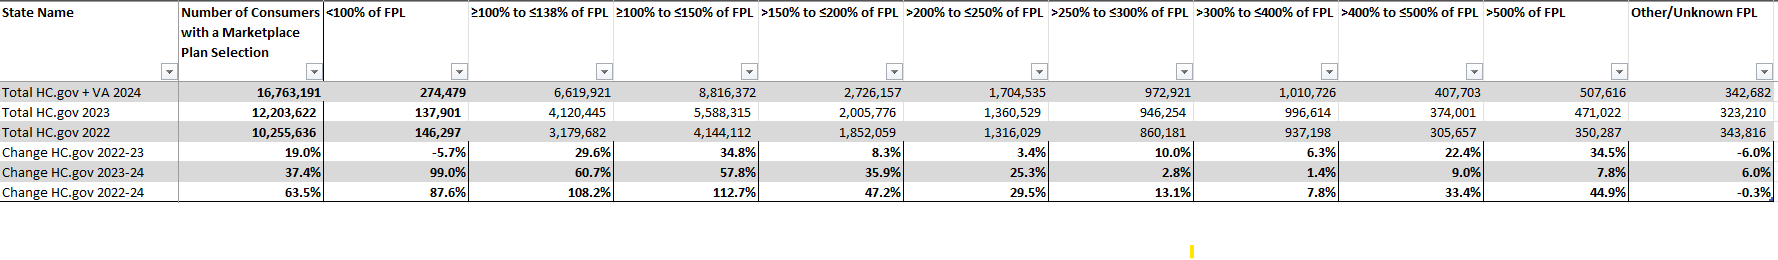
Enrollment growth rates by income level in HealthCare.gov from 2022-2024 do show a sharp fall-off in the 250-400% FPL range. The huge bulge at 100-150% FPL, however, is mostly explained by the Medicaid unwinding (as discussed above), and the unwinding also probably washes up to the next income brackets. There is also strong growth above 400% FPL, the income cap for subsidy eligibility in years prior to 2022.
The data below is from CMS’s Marketplace OEP Public Use Files, 2022-2024. As Virginia converted to a state-based marketplace in 2024, I have added VA figures into the Hc.gov 2024 totals.
Do some enrollees in the ACA marketplace mis-estimate their income to their own advantage? For sure. Do agents and nonprofit assisters sometimes help them do it, making them aware of key break points if nothing else? Undoubtedly. Are people in nonexpansion states whose actual income would put them in the “coverage gap” (below 100% FPL) jumping that minimum income threshold? I certainly hope so — though even if all future estimates were made in complete ignorance of the eligibility threshold a significant portion would probably fall below it in the coming year. The policy cure for people overleaping the coverage gap is to end the coverage gap by expanding Medicaid. Do some enrollees underestimate their income to get lower premiums or CSR? Some, for sure, although most people don’t like accruing a big tax bill at tax time, and zero-premium bronze coverage is generally available at incomes well above 200% FPL - -and the older the applicant, the higher up the income chain free coverage is available. Note also that enrollment growth since 2022 is quite high in income brackets above 400% FPL — which in prior years were ineligible for subsidies. That’s probably mainly because people who were previously subsidy-ineligible chose to enroll when subsidies became available, but perhaps some enrollees who previously took care to keep income below 400% FPL (e.g., with deductions such as retirement contributions) do not feel that imperative with the income cap on eligibility removed.
It’s worth noting too that in Texas, which alone accounts for 2.1 million of the nation’s 9.4 million enrollees in the 100-150% FPL income range, a law passed in 2022 has made gold plans consistently cheaper than silver plans, creating significant bargains for enrollees with income above 200% FPL. In Dallas, a single 50 year-old with an income of 250% FPL ($36,450 annually) can get a free bronze plan (with doctor visits and generic drugs not subject to the $7,500 deductible), or a gold plan for $68/month, well below the $121/month required for benchmark silver. Takeup of CSR in Texas is relatively low: just 70% of enrollees in the 100-150% FPL income bracket obtained it in 2024. Still, 61% of Texas enrollees have income in the 100-150% FPL.
As Texas is the cruelest of nonexpansion states, in which very few adults who are not pregnant or over age 65 qualify for Medicaid, and has the highest uninsured rate in the country — 16.6% in 2022, compared to 8.0% for the country as a whole, I’d have to say the more people near the poverty threshold who find their way to marketplace coverage, the better. Blase doubtless disagrees.
- - -
* Legally present noncitizens subject to the federal 5-year bar to Medicaid eligibility are eligible for premium subsidies even if their income is below 100% FPL. CMS has provided totals at incomes below 100% FPL only in PY 2016 and 2022-2024, ranging from 1-3% of total enrollment.
** ** Blase cites a different Lurie/Pearce paper that I cannot locate. He writes: “Using Tresury’s [sic] estimates suggests that 50 percent additional people could be between 100 percent and 150 percent of poverty ages 0-64. Treasury estimates 31.9 million versus 21 million in the ACS. Treasury estimates there are 9.3 million people aged 0-64 who have income between 100 percent to 150 percent FPL after excluding those with government and employer coverage. Our primary estimate of potential enrollees, which excludes children, seniors and people with Medicaid or Medicare, totals 7.0 million without New York, Minnesota, and the District of Columbia. Our expansive estimate, which includes those in this income range who report Medicare or Medicaid is 12.0 million.
*** According to data downloadable from KFF”s June unwinding tracker, 14.0 million out 23.8 million unwinding disenrollments (59%) were in HealthCare.gov states. I can’t find the KFF January totals at this point, so I’m assuming that the HealthCare.gov share was more or less the same then, though states are in fact doing redeterminations at different paces.
**** Blase’s Figure 4 claims that the 2020 PUF shows 41% of enrollees in 2020 with income reported in the 100-150% FPL range. I assume he is citing percentages for HealthCare.gov states, since CMS does not give totals for all states (just a couple of SMB state totals by income are missing, and the numbers are small; I estimated Idaho and Nevada together at 26,000 for the 100-150% FPL range to get national totals, and any error there would have a negligible effect on the 28% of all enrollment I cited). I used a national total because the IRS numbers are national.
***** It’s true that while HealthCare.gov may ask for verification of what looks like a too-high income estimate, they will not challenge any verification supplied. As Blase notes, court order-mandated rule change has ensured that. (Income verification is designed to flag estimates that appear to be too low, boosting subsidies, and is more rigorous on that front.)
No comments:
Post a Comment