Note: All xpostfactoid subscriptions are now through Substack alone (still free), though I will continue to cross-post on this site. If you're not subscribed, please visit xpostfactoid on Substack and sign up.
CMS has published its 2024 Marketplace Open Enrollment Period Public Use Files, providing detailed breakouts of enrollment by income, metal level selection, demographics, etc.
We already knew that enrollment increased by 31% nationally this year, spurred in part by the Medicaid unwinding — that is, the resumption of Medicaid redeterminations and disenrollments after a three-year pandemic-induced moratorium. While there’s always much to explore in the PUFs, two facts jump off the page for me:
Enrollment growth was heavily concentrated at low incomes — up 61% at 100-138% FPL and 54% in the slightly broader 100-150% FPL bracket. That’s perhaps not surprising, given that CMS announced that 2.4 million Medicaid disenrollees had enrolled in the 32 states using the federal platform, HealthCare.gov (and perhaps 2.9 million nationally, by Charles Gaba’s estimate). Year-round enrollment at incomes up to 150% FPL has likely also boosted enrollment in this bracket [added 3/23/24].
The decline in silver plan selection at low incomes that I flagged last March has continued. That is, growing numbers of low-income enrollees are forgoing Cost Sharing Reduction, available only with silver plans. At incomes up to 200% FPL, CSR makes silver plans roughly equivalent to platinum. Since March 2021, at least two CSR-enhanced silver plans in each rating area, with an actuarial value of 94%, are available at zero premium to enrollees with income up to 150% FPL. In the 150-200% FPL bracket, the benchmark (second cheapest) silver plan costs 0-2% of income (topping out at about $45/month for a single person) and has an actuarial value of 87%. Yet silver plan selection in the 100-150% FPL bracket was just 76.4% in HealthCare.gov states, down from 84.9% in 2022 and 89.3% in 2017. In the 150-200% FPL bracket, silver crashed from 69.5% last year to 56.7% this year. It was 83.2% in 2017.
Let’s look first at enrollment growth by income.
Marketplace enrollment change by income, 2023-2024
FPL = Federal Poverty Level. Numbers in green are estimates (see note below)
Virginia launched an SBM in 2024. Here, Virginia totals in 2023 are imputed to the SBM group.
Source: CMS Marketplace Open Enrollment Public Use Files

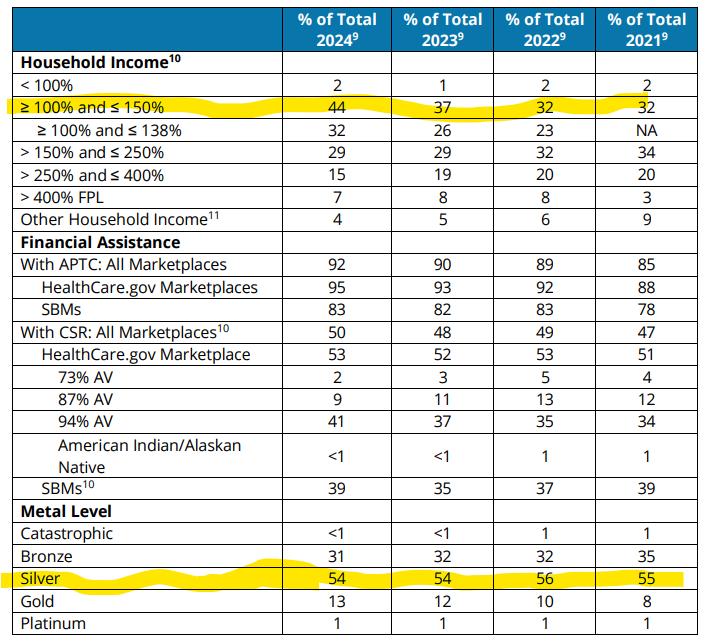
Here are the totals in broader income categories:

Along with the strong enrollment growth at incomes up to 200% FPL, the very limited growth in the 250-400% FPL range is noteworthy. So is a major spike at incomes below 100% FPL (totals at income below 100% FPL were oddly low last year compared to 2016, the last year before 2023 in which this income category was broken out separately). In that category, the only subsidy-eligible individuals are legally present noncitizens subject to the federal 5-year bar on Medicaid eligibility (or longer waiting periods in some states). Judging by CSR takeup, most but not all enrollees at incomes below 100% FPL are in this category. In HealthCare.gov states, 59.5% of enrollees with income below 100% FPL selected silver plans, compared with 76.4% in the 100-150% FPL bracket.
A note about the estimated totals marked in green above: Totals for SBM states at 400-500% FPL and above 500% FPL were not broken out in 2023. To get aggregated totals with income above 400% FPL or unknown above in SBM states and all states in 2023 (in the second table above), I added totals for all income brackets provided, subtracted them from total enrollment, and split the difference between the 400-500% FPL and > 500% FPL brackets. While that split is imprecise, the total for the two categories combined should be accurate, and so should totals for “> 400% FPL + Unknown” in the second table.
Silver selection down at low incomes
Now let’s turn to CSR takeup — that is, silver selection — at incomes at which CSR raises silver plan actuarial value to a roughly platinum level (94% AV at incomes up to 150% FPL, 87% AV at incomes from 150-200% FPL). After a slight spike in 2022, the first OEP in which the ARPA subsidy boosts were in effect, CSR takeup is down for the second straight year. Totals below are for HealthCare.gov states only, because in past years some SBM states did not break out metal level selection by income.

One point that jumps out is the spike in gold enrollment at low incomes. Most of that is attributable to Texas, where thanks to a statute passed in 2022, gold plans are far cheaper than silver (silver is priced as if all silver plan enrollees have incomes below 200% FPL, which is not far from the truth). In Texas, the average lowest-cost gold plan is priced 12.6% below the average lowest-cost silver plan. 24.0% of Texas enrollees with income up to 150% FPL selected gold in 2024, as did 46.4% of those in the 150-200% FPL bracket. In fact Texas accounted for 82% of all gold plan enrollees with income below 150% FPL nationally, and 56% of gold enrollment at 150-200% FPL.
Bronze plan selection has also risen substantially since 2022 in the 100-150% FPL bracket, however - - and it’s really spiked in the 150-200% FPL bracket. And whether they select bronze or gold, enrollees with income up to 200% FPL are exposing themselves to much great maximum out-of-pocket costs, as I noted last year (numbers updated):
CSR raises the actuarial value of a silver plan from a baseline of 70% (silver with no CSR) to 94% for people with income up to 150% FPL, and to 87% for enrollees in the 150-200% FPL income range. That’s as compared to 60% AV for a bronze plan and 80% for gold. The average silver plan deductible in 2024 is $90 at incomes up to 150% FPL and $737 at incomes in the 150-200% FPL range — compared to $7,258 for bronze and $1,430 for gold. (It should be noted, though, that 13% of bronze plans are $0 deductible, and in many cases primary care or even specialist visits are not subject to the deductible.)
Differences between CSR-enhanced silver (at incomes below 200% FPL) and other metal levels in annual maximum out-of-pocket costs (MOOP) are equally stark. The MOOP averages $1,388 in silver plans at incomes up to 150% FPL and $2,809 for silver in the $150-200% FPL range. Bronze plan MOOP usually tops $8,000, and in most gold plans as well. Low-income enrollees who forgo CSR are exposing themselves to thousands of dollars in potential out-of-pocket costs from which CSR in silver plans would protect them (if they stay in-network when obtaining care).
Last year I noted that active re-enrollees at incomes below 200% FPL obtained CSR at higher rates than new enrollees and passive re-enrollees. That difference seems to have narrowed this year. Among those with income below 150% FPL (including those with income below 100% FPL), 77.9% of active enrollees obtained CSR, compared to 71.2% of passive re-enrollees and 73.9% of new enrollees.
Over the past year I’ve come to suspect that a growing number of low-income enrollees are choosing bronze or gold plans with eyes wide open, accepting greater out-of-pocket exposure to be able to afford coverage from an insurer offering a more robust provider network or other advantage (such as coverage of needed drugs). Brokers, navigators and analysts have pointed me to cases in states including Texas, South Carolina, California and Colorado in which plans from insurers with better provider networks are priced significantly above benchmark. In some cases enrollees downshift a metal level after new market entrants with narrow networks undercut more established players, often Blues. I describe some of these tradeoffs in detail in this post.
Gold plans priced below or on par with silver plans, as they are in about 15 states, facilitate such tradeoffs, as do zero-deductible bronze plans. In total, gold plans accounted for a record 13.4% of enrollment this year, up from 11.9% in 2023, the previous record. More states are considering mandating strict premium alignment, which ensures that gold plans will be priced below or on rough par with silver (as most silver plan enrollees in most states obtain AVs of 94% or 87%, compared to 80% for gold.
There’s much more to dig into in the PUFs — including gold plan selection at higher incomes. Stay tuned…
Update, 3/23/24: Just recalling a point I forgot to include. While silver selection is down in the lowest income brackets, the infusion of low-income enrollees (most of whom still do choose silver and so get CSR) is so large that the average actuarial value obtained by marketplace enrollees is just about where it always was: about 80% in HealthCare.gov states. Enrollment in the 100-150% FPL income bracket, where free high-CSR silver is available, accounted for 43.8% of all enrollment in 2024. That’s up from 37.2% in 2023 — and 26.5% in 2020. That growth is mainly driven by the states that have refused to expand Medicaid, where subsidy eligibility for the marketplace begins at 100% FPL, as opposed to 138% FPL in expansion states. Marketplace enrollment is up 147% since 2020 in the 11 states that had not expanded Medicaid as of November 1, 2023 (North Carolina launched its expansion on Dec. 1). Enrollment in those 11 states has grown by 7.3 million since 2020, and about half of enrollment in those states is at incomes below 150% FPL.
Update, 3/29/24: CMS released an OEP 2024 marketplace enrollment report today. Re silver selection at low incomes, the chart below tells the story: the proportion of enrollees with income in the 100-150% FPL range soared in 2024, while the proportion of enrollees selecting silver plans stayed constant. CSR enrollment ticked up only modestly despite the increased proportion of enrollees eligible for CSR.
No comments:
Post a Comment