Three charts may explain in part why the ACA is working as designed, improving life in America, and hurting Democrats politically.
First, Gallup's latest on the uninsured rate:

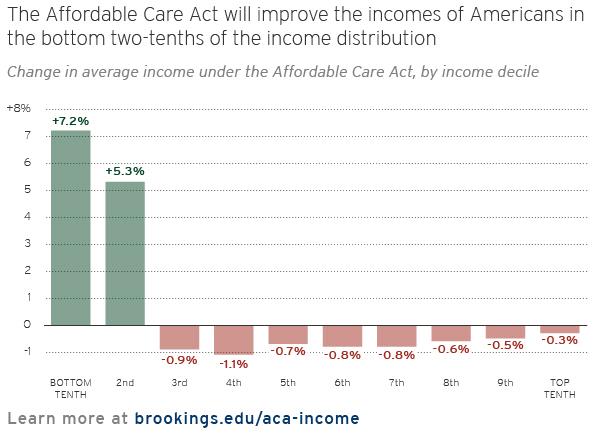
Next, an assessment of the redistributive effects of the ACA by Henry Aaron and Gary Burtless (via Bill Gardner) :

And finally, some data from Pew about white voter preferences in the last election:

See that? Democrats got the bottom segment only -- the group that benefits most immediately and directly from the ACA. Gallup's latest poll bears this out -- along with the politically charged ethnic corollaries :
First, if the ACA really is contributing to a long-term slowdown in the growth of US healthcare spending -- admittedly a big 'if' though the data is promising -- it could secure the nation's fiscal future. Second, in recent decades both low income and lack of health insurance are conditions that huge swaths of the U.S. population cycle through. According to the Census Bureau's Survey on Income and Program Participation (SIPP), from 2003-2007, 71% of Americans 18-64 had continuous health insurance, 6% had no coverage at all, and 23% were uninsured for part of that time (Stephen J. Rose, Rebound, 189-90). In an even shorter time frame, as John Graves and Rick Curtis noted in a Nov. 2013 Health Affairs blog post, "a study by Mathematica Policy Research found that 7.7 percent of non-elderly persons were uninsured for the entire year, while on average 15.9 percent were uninsured in a given month, and 27 percent were ever uninsured at some point during the year. That study further found that as of January 2001:
In the short term, though, more Americans continue to tell the Kaiser Family Foundation that the ACA has hurt them than that the law has helped them:

Obviously "helped or hurt?" is viewed through a strong partisan lens, but the perception of harm is high among independents as well as Republicans (though as Dana Houle reminds me, those who self-identify as independents have shifted right in the last 10 years or so). That may be due in part to a successful five-year smear campaign, but also probably reflects the fact that employers regularly cite the ACA when announcing new or raised deductibles and co-insurance and new restrictions on coverage.
Addressing a dominant social problem with a comprehensive program that is so far meeting its ambitious goals is not helping Democrats politically. That's a harsh political reality -- but one that I think Democrats will be willing to accept... if the Supreme Court doesn't nuke the whole massive edifice.
UPDATE, 3/16/15: Last week, HHS released ACA private plan enrollment data that provided more information than previously on the income levels of ACA enrollees. In the 37 states using healthcare.gov, 68% had household income under 200% of the Federal Poverty Level (FPL). The numbers are lower in the 13 states operating their own exchanges -- both because their median household incomes are higher on average than those of the hc.gov states and because they all expanded Medicaid, which means that their QHP pool starts at 138% FPL, rather than the 100% threshold that applies in non-expansion states. In any case, the very high concentration below 200% FPL seems in sync with Aaron and Burtless' projections.
First, Gallup's latest on the uninsured rate:
Next, an assessment of the redistributive effects of the ACA by Henry Aaron and Gary Burtless (via Bill Gardner) :
See that? Democrats got the bottom segment only -- the group that benefits most immediately and directly from the ACA. Gallup's latest poll bears this out -- along with the politically charged ethnic corollaries :
While the uninsured rate has declined across nearly all key demographic groups since the Affordable Care Act went into effect a year ago, it has plunged most among blacks and lower-income Americans. The uninsured rate among blacks dropped seven points over the past year, while the rate among Americans earning less than $36,000 in annual household income dropped 6.9 points.Over the long term, if Republicans don't destroy it, the ACA as it evolves will help far more than the lowest quintile of Americans -- or rather, by helping primarily the poorest at any given time, it has the potential to foster shared economic growth and improved security for all but the wealthiest.
The Hispanic population remains a key target of the healthcare law's marketing efforts, as it continues to be the subgroup with the highest uninsured rate, at 32.4%. Still, the percentage of uninsured Hispanics is down 6.3 points since the end of 2013.
First, if the ACA really is contributing to a long-term slowdown in the growth of US healthcare spending -- admittedly a big 'if' though the data is promising -- it could secure the nation's fiscal future. Second, in recent decades both low income and lack of health insurance are conditions that huge swaths of the U.S. population cycle through. According to the Census Bureau's Survey on Income and Program Participation (SIPP), from 2003-2007, 71% of Americans 18-64 had continuous health insurance, 6% had no coverage at all, and 23% were uninsured for part of that time (Stephen J. Rose, Rebound, 189-90). In an even shorter time frame, as John Graves and Rick Curtis noted in a Nov. 2013 Health Affairs blog post, "a study by Mathematica Policy Research found that 7.7 percent of non-elderly persons were uninsured for the entire year, while on average 15.9 percent were uninsured in a given month, and 27 percent were ever uninsured at some point during the year. That study further found that as of January 2001:
17.6 percent of this population lacked health insurance coverage. Over the 36-month reference period of the 2001 SIPP panel, roughly twice that fraction (35.0 percent) had some amount of time in which they were not covered by health insurance. How much time? Nearly 60 percent were without coverage for 12 months or more, and more than a third were uninsured for at least two of the three years. These include 4.5 percent who were uninsured the entire time.Extend the time frame further, and an even larger percentage of the population has surely experienced periods of uninsurance.
In the short term, though, more Americans continue to tell the Kaiser Family Foundation that the ACA has hurt them than that the law has helped them:
Obviously "helped or hurt?" is viewed through a strong partisan lens, but the perception of harm is high among independents as well as Republicans (though as Dana Houle reminds me, those who self-identify as independents have shifted right in the last 10 years or so). That may be due in part to a successful five-year smear campaign, but also probably reflects the fact that employers regularly cite the ACA when announcing new or raised deductibles and co-insurance and new restrictions on coverage.
Addressing a dominant social problem with a comprehensive program that is so far meeting its ambitious goals is not helping Democrats politically. That's a harsh political reality -- but one that I think Democrats will be willing to accept... if the Supreme Court doesn't nuke the whole massive edifice.
UPDATE, 3/16/15: Last week, HHS released ACA private plan enrollment data that provided more information than previously on the income levels of ACA enrollees. In the 37 states using healthcare.gov, 68% had household income under 200% of the Federal Poverty Level (FPL). The numbers are lower in the 13 states operating their own exchanges -- both because their median household incomes are higher on average than those of the hc.gov states and because they all expanded Medicaid, which means that their QHP pool starts at 138% FPL, rather than the 100% threshold that applies in non-expansion states. In any case, the very high concentration below 200% FPL seems in sync with Aaron and Burtless' projections.
At the insurance brokerage where I work, about 60% of the older small group plans and 75% of the older individual policies have seen very large increases between 2010 and today. (larger then the usual health care inflation)
ReplyDeleteThe ACA is in fact behind this, with its new standards for group insurance risk classes and the introduction of guaranteed issue to the individual markets.
What I am saying is that for every working poor person who has a better deal from the ACA, there is another working person a little higher in the middle class who is worse off financially.
I do not think that every opponent of the ACA even understands this. The ACA has lost a lot of favor among senior citizens for something that never actually happened (the threatened cuts to Medicare Advantage).
But rather than raise income taxes on the upper middle class ($90,000 income and above)v-- quite a few of whom are Democrats --
the ACA has proceeded more to carve up favors and disfavors across classes.
Bob, I would like to hear more about what you see in small group plans. One question is whether employees of a lot of small businesses wouldn't be better off in exchanges. Also, if SHOP ever really gets going, can it help by expanding small biz risk pool?
ReplyDeleteAs for the individual market, I believe that winners should far outnumber losers. Here is one calculation I made based on CBO projections (full post here http://bit.ly/1wGLQlk):
Those subject to ACA 'rate shock' are far outnumbered by the ACA's beneficiaries, but their ranks are still substantial. According to various estimates, 10-14 million people were insured in the pre-ACA individual market. According to an Urban Institute estimate, slightly more than half of 12 million qualified for ACA subsidies. Of the subsidy-ineligible now in the market, somewhere between 20 and 50 percent probably have a family member with a pre-existing condition -- and maybe more.** It may be fair to say, then, that somewhere between 2 million and 5 million people are paying more for insurance under the ACA than they would have had the law not taken effect.
Viewed from another perspective, the CBO projects that 25 million people will buy health insurance on the ACA exchanges in 2018, 20 million of them subsidy-eligible. CBO further projects that an additional 5 million will buy insurance off-exchange in the individual market. Another 13 million will be covered thanks to the ACA Medicaid expansion. At present, about 3 million adults aged 21-26 remain insured through their parent's plans thanks to the law. If we postulate that 30% of the ten million unsubsidized insureds in the individual market in 2018 have a plan member with a pre-existing condition, there might be 7 million paying more for individual market insurance in 2018 than they would have with no ACA, versus perhaps 36 million direct beneficiaries of the law.
I cannot disagree with the above. However, the 7 million who have to pay more have (so far) made just as much political noise as the 36 million potential beneficiares. With plenty of help from Republicans, of course.
ReplyDeleteNote also that if Medicaid had been expanded nationwide to 133% of poverty, and if those with pre-ex conditions had been allowed to buy into Medicaidi or Medicare, we could have left the 7 million alone. Of course to do things my way we would have had to raise income taxes on everyone middle class and above, including those Democrats with good employer coverage.
Andrew --- I wrote about statistical underwriting transitioning to community rated underwriting at Balloon Juice last winter :
ReplyDeletehttp://www.balloon-juice.com/2014/02/07/why-there-will-be-rate-shock-stories-this-fall/
-- On average, the total cost of premiums to insure the same people in the same groups with experience or statistical underwriting versus community underwriting will be the same. However the distribution of those costs will be wildly different. Groups that are more male and/or healthier in general will see significant rate increases due to underwriting changes. Groups that are more female or statistically likely to be sicker than average will see flat rates or decreases.
There are winners and losers in the change to community underwriting. The losers will scream much louder than the winners will sing. ----