Note: Free xpostfactoid subscription is available on Substack alone, though I will continue to cross-post on this site. If you're not subscribed, please visit xpostfactoid on Substack and sign up.
 |
| Rub it in, CMS |
As I noted in my last post: Exacerbating the huge increase in premiums that subsidized ACA marketplace enrollees will face in 2026 if the enhanced subsidies funded through 2025 are not extended, Trump’s CMS finalized a rule change in June 2025 that increases net-of-subsidy premiums by changing the method by which health insurance premium growth is calculated. The question is by how much, and I now have an answer.
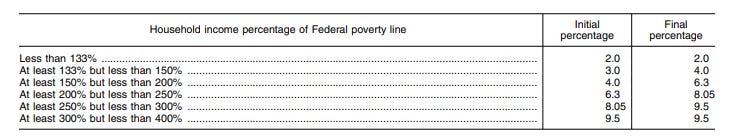
Background, in brief: every year, CMS calculates the ratio between the growth of private health insurance premiums and growth in personal income since 2013 (the year preceding ACA enactment). Prior to the enhanced subsidy schedule enacted in the American Rescue Plan Act (ARPA) in March 2021 (which “froze” the enhanced subsidy level), if the resulting Premium Growth over Income Growth (PGIGI) index is above 1.0, the percentage of income subsidized enrollees have to pay for a benchmark silver plan rises proportionately above the subsidy schedule originally set in 2014. If the PGIGI is below 1.0, those “applicable percentages” of income paid by enrollees in each income brackets drop below the 2014 baseline; more commonly, the required percentages of income rise by a few percentage points. Each year, the change in PGIGI from the previous year is proportionate to the change in the applicable percentages. Here is the original subsidy schedule:
In 2025, the PGIGI was the lowest ever — 0.910 — which generated the lowest “applicable percentages” ever — e.g., a top rate of just 8.65%. The resulting subsidy schedule was moot, because the applicable percentages created by the enhanced subsidy schedule that expires after 2025 are far lower. But CBO calculated the applicable percentages for use in a cost estimate for extending the enhanced subsidies, and KFF used them in its initial estimates (published in mid-2024) of how much more subsidized enrollees will pay in 2026. The low 2025 PGIGI generated lowball estimates: the PGIGI actually used by the IRS to create the 2026 subsidy schedule is the highest ever: 1.048, or 15.1% higher than in 2025. That partly explains the jump in KFF’s updated estimate of how much more the average subsidized enrollee will pay if the enhanced subsidies expire, from 75% more than in 2025 to 114%.
With help from Matthew Fiedler of the Brookings Institute, I can report the extent to which the rule change increases the “applicable percentages” of income that enrollees in different income brackets will pay. The impact is lower than I inferred in my last post (which I’ve corrected), for reasons I’ll explain below, but it may rise in future if the enhanced subsidies are allowed to expire.
Here is the difference between the subsidy schedule as it’s currently set for 2026 versus what it would have been absent the rule change. Explanations to follow.
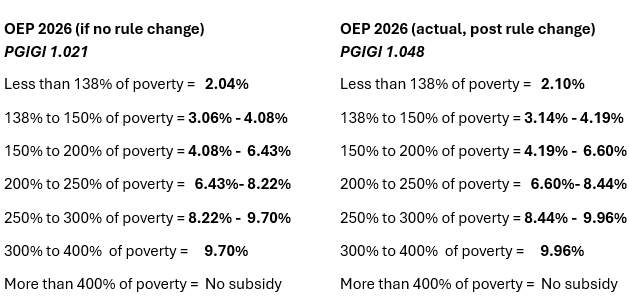
Sources: IRS, NHE, Matt Fiedler’s estimate of PGIGI if not for rule change
Here is the effect of the rule change on premiums for the benchmark (second cheapest silver) plan for subsidized enrollees.
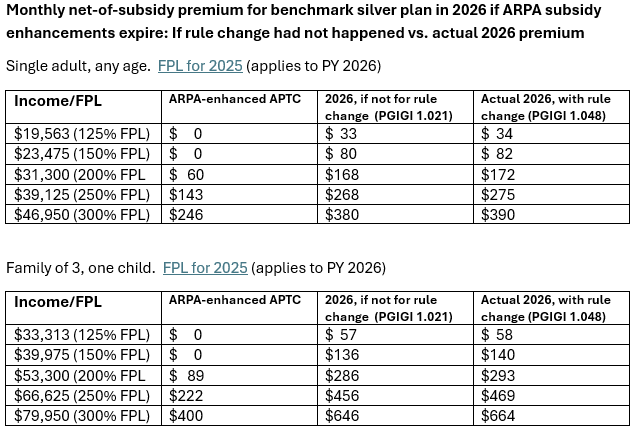
Why the increase (2.6%) in net-of-subsidy premiums over what they would have been minus the rule change? In its so-called Marketplace Integrity and Affordability Rule, finalized in June 2025, Trump’s CMS re-instituted a change in method for calculated health insurance premium growth finalized by the first Trump administration in 2019 and rescinded (pdf pg. 86) by the Biden administration in advance of plan year 2022. The Trump administration incorporates premiums in the individual market for health insurance — mainly, ACA marketplace premiums — into the calculation, which is still based mainly on premiums in employer-sponsored insurance, which account for 86% of the total. Premium growth is calculated since 2013, the year before the ACA marketplace was launched, and projected forward into the coming year. Now, the ACA changed individual market insurance, mandating that it be far more comprehensive than in the past and that it be sold without regard to pre-existing conditions. As a result, average “direct purchase” premiums rose 39% in 2014, according to the National Health Expenditures (NHE) estimate on which the PGIGI is based. Individual market premiums rose another 13% in 2017, a year of correction in the ACA marketplace, and 16% in 2018, a year of Republican-induced turmoil, including attempted repeal and cutoff of direct CSR reimbursement. In total, according to the current NHE, “direct purchase” premiums rose 141% from 2013 to 2023, vs. 50% for premiums in employer-sponsored insurance. Including the individual market juices the premium growth side of the PGIGI equation.
The marketplace integrity rule explains that the new method raised the PGIGI for 2026 from the 0.962 announced by the Biden administration to 1.006 — a 4.6% increase, which accounts for almost half of the increase from the 2025 PGIGI, 0.910, as I wrote in my last post. That new PGIGI was used to set out-of-pocket maximums and the annual Required Contribution Percentage. Unbeknownst to me, however — and explained by Matt Fiedler — when creating the subsidy schedule for 2026 in July, the IRS used a new PGIGI, based on new NHE projections published simultaneously with the final rule on June 25, 2025.
That operative but unpublished PGIGI is 1.048, the highest ever. Fiedler provided me with this figure, and I was able to reproduce it, dividing the NHE totals for premium growth by income growth from 2013-2025 (including estimates for 2024 and 2025).* [Update, 10/11/25: it occurred to me in the wee hours that there’s a much simpler way to do this: simply divide the highest applicable percentage in the current subsidy schedule by the 2014 baseline, i.e., for 2026, 9.96/9.5.]
Fiedler was also able to calculate what I could not: what the updated PGIGI would have been under the superseded Biden/Obama method (based on ESI growth only). That would-have-been PGIGI is 1.021. [Update, 10/12/25: it’s further dawned on me that this too is a simple calculation: in the NHE tables showing spending per enrollee, simply substitute “employer sponsored insurance” for “private health insurance.” See note below.]
That means that the gap between old method/new method PGIGI calculation narrowed under the updated NHE projection, from a 4.6% increase under last year’s NHE (from 0.962 to 1.006) to a 2.6% increase (from 1.021 to 1.048). It seems that the new NHE projects relatively more new growth in ESI premiums than in individual market premiums. The NHE does show more growth in ESI premiums than in individual market premiums in every year from 2019 forward, and anticipates more rapid growth in ESI than in the individual market through 2028. That could change, though, as the Trump administration and Republican Congress work to introduce more turmoil in the ACA marketplace.
The Trump administration’s CMS explicitly prefers making ACA marketplace enrollees pay more and taxpayers pay less, and exploits every policy lever at its disposal to make that happen, including a host of measures designed to inhibit enrollment, and likely new measures to encourage enrollment in lightly regulated, ACA-noncompliant alternatives. The PGIGI method change rubs a bit more salt in the wounds of current enrollees facing average premium increases north of 100%.
- - -
* Here is the PGIGI calculation: according to the NHE, private health insurance spending per enrollee rose from $4,715 in 2013 to a projected $8,425 in 2025, while personal income rose from $44,521 to $75,904, yielding a ratio of 1.7868504772/1.704903304, or 1.048. Update, 10/12: spending per enrollee in employer-sponsored insurance, the measure the Biden administration used, rose from $4,896 in 2013 to a projected $8,422 for 2025, yielding a PGIGI of 1.7406045752/1.704903304.or 1.021.
No comments:
Post a Comment