Note: All xpostfactoid subscriptions are now through Substack alone (still free), though I will continue to cross-post on this site. If you're not subscribed, please visit xpostfactoid on Substack and sign up.
 |
| CBO inside |
As we near the end of the ACA marketplace’s Open Enrollment Period (OEP) for 2025, CMS is out with a new enrollment snapshot showing 23.6 million plan selections. As OEP has another week to go in the 32 states using HealthCare.gov, and up to 23 days more in some state-based marketplaces, Charles Gaba estimates final enrollment at 24.2 million*, up about 13% over OEP 2024 — and just about double the 12.0 million total in OEP 2021. That was the last year before the Democratic Congress and the Biden administration changed the game by radically boosting premium subsidies and expanding eligibility for them as part of the American Rescue Plan Act (ARPA), enacted in March 2021 (and effective immediately during an emergency Special Enrollment Period that had started on February 15).
The ARPA subsidy increases made benchmark silver coverage with strong Cost Sharing Reduction free to enrollees with income up to 150% FPL; removed the 400% FPL cap on subsidy eligibility; and reduced the percentage of income required for the benchmark silver plan at all income brackets in between. Enacted as a pandemic measure lasting only through 2022, the enhanced subsidies were extended through 2025 by the Inflation Reduction Act, enacted in August 2022. If the Republican Congress declines to extend the ARPA subsidy boosts, OEP 2025 will stand as the marketplace’s high-water mark, and millions will drop coverage beginning in 2026 (7.2 million according to the Urban Institute’s estimate).
I have written more than once that the ARPA subsidy boosts brought the ACA within striking distance of fulfilling the mission expressed in its name (affordable coverage for all who lack access to pre-ACA sources of health insurance) and envisioned by its drafters — and by the Congressional Budget Office, e.g., in its final projection prior to enactment, on March 20, 2010. That is almost literally true now. Enrollment in the ACA’s core programs — the Medicaid expansion and the subsidized marketplace — is quite close to the 2010 CBO ten-year projections, albeit six years late (and just shy of four years after ARPA was enacted — when, in a sense, the clock restarted).
Top line, the CBO in 2010 was almost dead-on as to the ACA’s long-term effect on the uninsured rate, forecasting that 92% of the nonelderly U.S. population would be insured ten years in. That wasn’t true in 2019 (pre-pandemic, pre-ARPA), but it’s close to true now. The latest quarterly estimate from the National Health Interview Survey (NHIS), for Q2 2024, pegs the uninsured rate in the under-65 population at 9.1%. In 2010 CBO forecast 23 million uninsured as of 2019; the NHIS pegs the uninsured population (all ages) at 25.3 million in Q2 2024.**
I cannot locate the March 2010 CBO report on the ACA’s likely effects (updates from 2011 forward are readily available), so I’ll have to rely on an old printout. Forgive some old scribblings in the 2015 column.
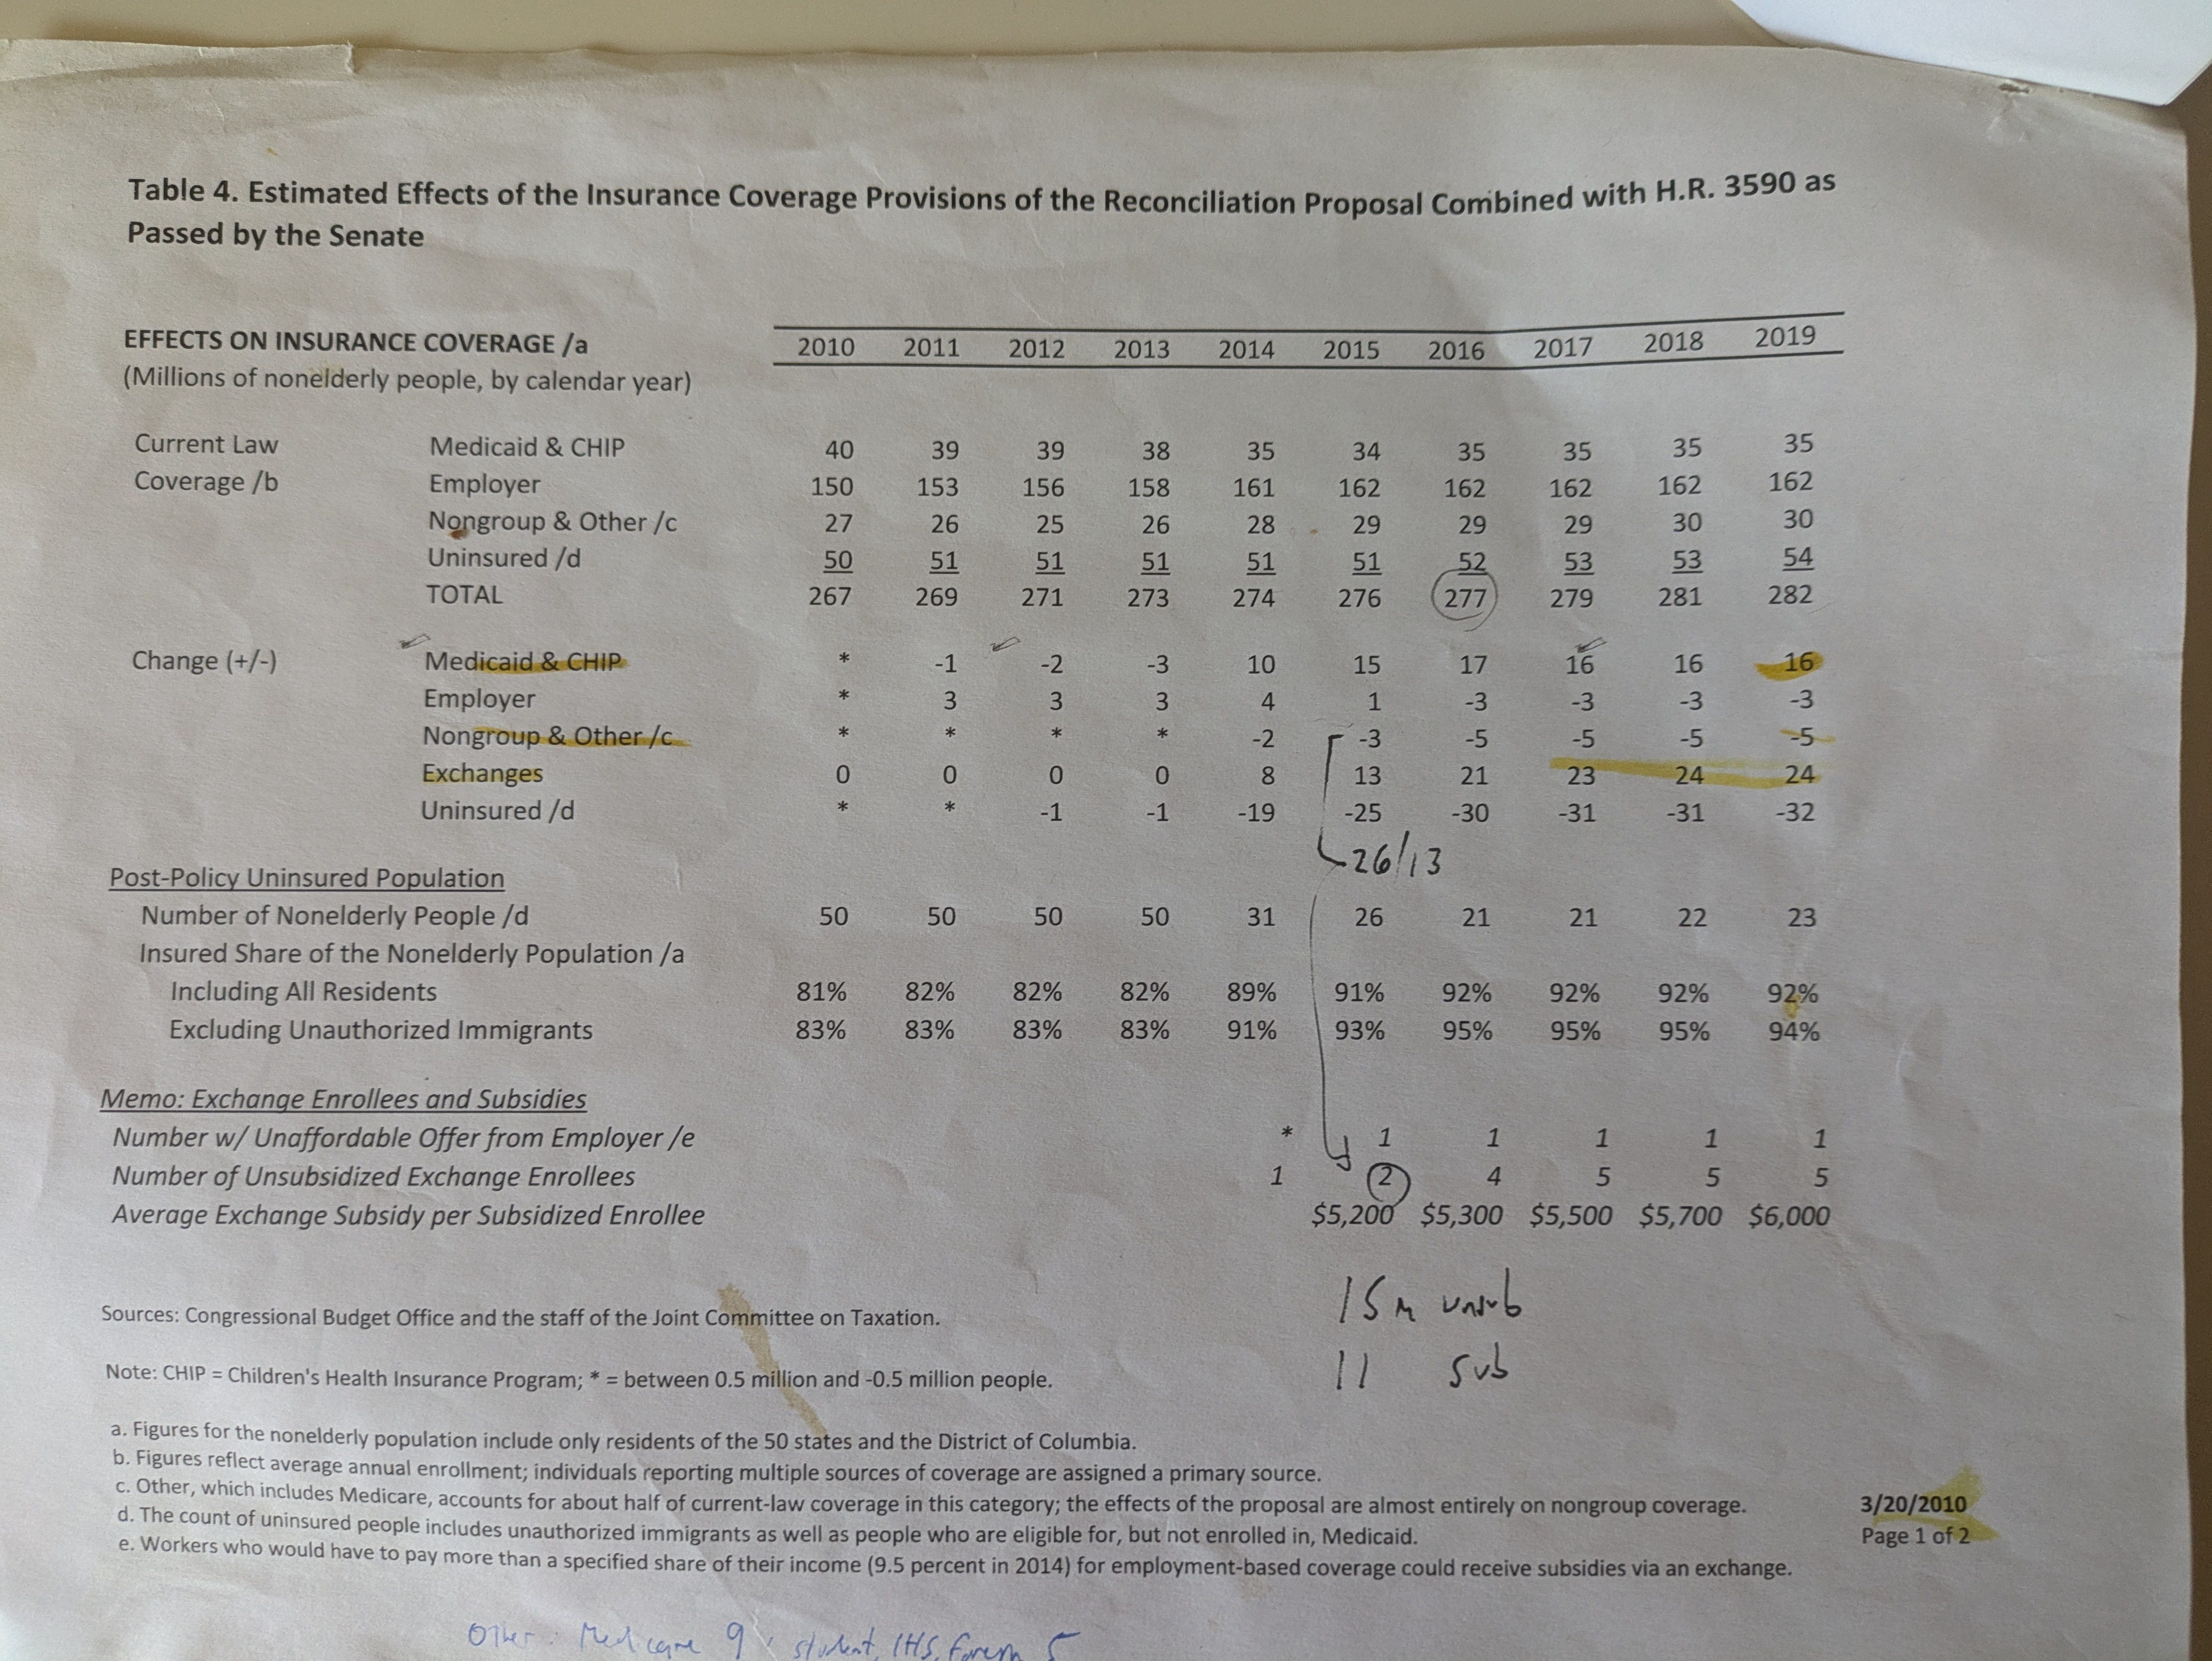
Some notes as to the forecasts for 2019:
CBO anticipated the marketplace approaching full capacity with 23 million enrollees in 2017, its fourth year of operation, edging up to 24 million in 2018 and remaining at that level in 2019. Current enrollment is…24 million. (Add 1.8 million in the Basic Health Programs established in three states, which CBO did not anticipate — see the first note at bottom.)
CBO projected a net increase of 16 million in Medicaid enrollment from 2010 to 2019. There are a couple of ways to assess this projection. First, as of September 2019, total Medicaid enrollment was up 15.1 million from July-September 2013, the pre-ACA comparison point used by KFF.
Viewed another way, the total number of Medicaid enrollees rendered “newly eligible” by ACA expansion criteria (that is, adults with income up to 138% FPL who would not have been eligible by other criteria) was 16.6 million*** in June 2024 — the last month for which numbers are available. By that point, the “Medicaid unwinding” — resumption of disenrollments in May 2024 after a three-year pandemic-induced moratorium — was mostly over.
While getting the top line for increased Medicaid enrollment more or less right, CBO actually underestimated the ACA’s effects on Medicaid enrollment, as it expected the ACA expansion to be in effect in every state. In June 2012, the Supreme Court rendered the expansion optional for states, and initially only 24 enacted it. As of December 2019, 34 states had enacted the expansion; as of now, ten states, including Florida and Texas, still have not.
The persistence of “nonexpansion states” has inflated marketplace enrollment. In the ten remaining nonexpansion states, 5.8 million marketplace enrollees reported income in the 100-138% FPL range, which would have placed them in Medicaid had all states enacted the expansion.
In light of the points above, based on what it knew/assumed in 2010, CBO overestimated marketplace enrollment and underestimated Medicaid expansion (as about 6 million marketplace enrollees in nonexpansion states “ought” to be in Medicaid). Those misses more or less cancelled each other out as to the top line.
Medicaid enrollment increased by more than 20 million during the three-year moratorium on involuntary disenrollments enacted in March 2020 as part of the Families First Act, a pandemic relief bill. The “unwinding” — resumption of redeterminations and disenrollments — that began in spring 2023 was clumsy and cruel in many states, and too many children lost coverage. When the dust settled, however, enrollment was still 7.7 million higher in September 2024 than in March 2020, the eve of the pandemic, and the uninsurance rate may prove not to have risen. After a year-plus of unwinding, enrollment among those rendered eligible by ACA expansion criteria was up was 5.4 million higher in June 2024 than on the eve of the pandemic in March 2020.
CBO forecast a net drop in employer-sponsored insurance (ESI) of just 3 million over ten years. According the KFF’s annual survey based estimates, enrollment in employer-sponsored insurance was 3 million higher in 2010 (estimated at 157 million) than in 2024 (154 million). The labor force did increase by about 4.4 million from 2019 to 2024, perhaps suggesting a slight further shrinkage in ESI.
CBO also forecast a drop of 5 million from 2010 to 2019 in off-exchange “nongroup” insurance combined with “other” insurance — an opaque catch-all category that includes disability Medicare (about 7 million at present), student health plans, care at correctional facilities, and some other odds and ends. The drop was forecast to occur chiefly in off-exchange nongroup enrollment, and that drop was probably steeper than forecast, driven by a) a sharp rise in unsubsidized premiums in 2017-18, b) a steady fade-out of pre-ACA “grandfathered” and “grandmothered” (don’t ask…) plans, and c) by ARPA’s removal of the income cap on subsidies, which prompted a lot of new enrollment in the 400-600% FPL range. CBO probably underestimated the drop in off-exchange nongroup enrollment. In a 2019 brief, KFF estimated nongroup enrollment in 2011 (pre-ACA) at 10 million. By the first quarter of 2015, per KFF, off-exchange nongroup enrollment in ACA-compliant and noncompliant plans combined had dropped only modestly to 8.8 million, but after steep premium increases in 2017-2018 it plummeted to an estimated 3.3 million by Q1 2019. CBO estimates from June 2024 peg nongroup coverage bought outside the marketplace at a similar 3.1 million in 2024. That looks like a drop of about 7 million in off-exchange nongroup enrollment from the pre-ACA period to 2019 and beyond — perhaps 2 million more than forecast, though a lot of moving parts are involved.
It may seem somewhat dicey to compare 2025 totals to CBO’s 2010 projections for 2019. But I believe the comparison is instructive. The 2010 10-year forecast encompassed just six years of operation of the ACA’s core programs, which kicked off in January 2014 (though a few states started the Medicaid expansion early). Marketplace and Medicaid enrollment stalled, and in fact went into modest reverse, during the Trump years, until the pandemic struck. The ARPA subsidy enhancements, which have been in effect through four OEPs (2022-2025), represented a new beginning — and the premise here is that the enhanced subsidies enabled the marketplace to fulfill the function envisioned at the level envisioned.
ARPA made that fulfillment possible. In late 2009, as the ACA was writhing through multiple iterations in the Senate, it was plain to progressive advocates that the emerging subsidy schedule was inadequate to the marketplace’s purpose. In his 2011 book about the battle to pass the ACA, Richard Kirsch, national campaign manager from 2008-12 for Health Care for America Now (HCAN), an umbrella group formed by unions and progressive nonprofits to advocate for universal health care, took the inadequacy of the subsidies as a given:
In the President’s September address to Congress, the President not only made a concession on the public option. He also said, “the plan I’m proposing will cost around $900 billion over ten years.” Yet $900 billion was not enough money to make health care truly affordable to the uninsured. Why did the President make another, preemptive concession to the bill’s opponents, one that would significantly damage his core goal? An article co-authored by Robert Pear and The New York Times White House correspondent Jackie Calmes summarized the impact nicely: “The number suggests a political and fiscal calculation to avoid the sticker shock of the trillion-dollar threshold. But it probably means that Mr. Obama could fall short of his goal of providing universal coverage for all Americans because the lower cost may force lawmakers to reduce the subsidies needed to help more uninsured individuals and small businesses seeking coverage for employees.”...
While the marketplace roughly met enrollment goals in its launch year, 2014, and enrollment increased substantially in 2015, CMS officials in the later Obama years knew that enrollment would not grow in line with CBO projections — and starting in OEP 2018, team Trump took steps to ensure that enrollment would not grow (e.g., gutting funding for enrollment assistance and outreach, shortening the OEP, and standing up an alternative market of ACA-noncompliant plans). Average monthly enrollment reached a peak in 2016 that would not be passed until the pandemic and resulting job layoffs stimulated off-season enrollment in 2020 (as highlighted in the Average Monthly Enrollment column below). In 2021, ARPA took over, and the rest is the history we’ve been examining.
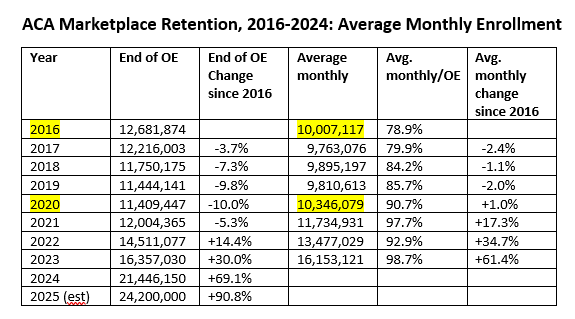
Sources: Marketplace Open Enrollment Public Use Files and Full-Year and February Effectuated Enrollment tables, available via the 2024 Early Effectuated Enrollment Snapshot.
None of this is to suggest that the marketplace is an unproblematic program (and wait till team Trump 2.0 gets hold of it). I personally think that a market of private plans offered mostly by for-profit insurers paying modified commercial rates to providers and pushed by competition toward very narrow provider networks is a suboptimal way to offer health coverage to those who lack access to other sources of insurance. Out-of-pocket costs in the marketplace are way too high; networks are too narrow; and the proliferation of plan choices in each market, numbering over 100 on average in 2024, is nonproductive and bewildering. All that said, coverage is currently available and affordable to most of those who need it. That wasn’t true until ARPA, and it’s a BFD. It very likely won’t be true in 2026 or any time soon.
- - -
* Another 1.8 million people are enrolled in the Basic Health Programs offered in lieu of the ACA marketplace to low-income enrollees by New York, Minnesota and Oregon (1.6 million of them in New York*). BHPs, an alternative provided to states by the ACA statute, are standardized, Medicaid-like plans with low out-of-pocket costs. New York’s Essential Plan is technically no longer a BHP, as the state extended eligibility to enrollees with income up to 250% FPL in 2024. By statue, BHPs can only serve enrollees with income up to 200% FPL. New York reorganized the Essential Plan, preserving its federal funding, via an ACA Section 1332 “innovation waiver.”
** Since 2019, the population has grown by about 9.3 million, suggesting that if CBO’s estimate for that year had been on target and remained stable until now, another 760,000 people would be uninsured. So the modest gap between the CBO 2010 estimate and the current NHIS estimate of the absolute number of uninsured is roughly in line with the percentage gap.
*** CMS offers two measures of ACA expansion enrollment in Medicaid: those rendered eligible by ACA criteria (“Group VIII”), and those rendered newly eligible by those criteria. The distinction stems from a handful of states independently extending Medicaid eligibility to all adults with income up to a threshold of 100% FPL or higher; in those states, a number of Group VIII enrollees would presumably remain eligible if there were no ACA expansion. In June 2024, there were 20.9 million Group VIII enrollees, 16.7 million of them “newly eligible.”
- - -
Non sequitur: some writing from me in a different mode, for kids.


